How-to — task-oriented recipe.
- Use the Affinity Data fields that are being pulled into your custom Salesforce fields
- Use the Email and Meeting Activity data that Affinity natively syncs into Salesforce Overview
Step 1. Create the reports
Before building the actual dashboard, you need to ensure your reports are in place, so we’ll start by creating a few reports. A few things to note before diving in:- Field labels may vary for every Salesforce Org
- After creating new reports, you can adjust the charts directly on dashboards
- All relationship scores listed in the examples below are out of 100, with 100 being the highest possible score
Getting started
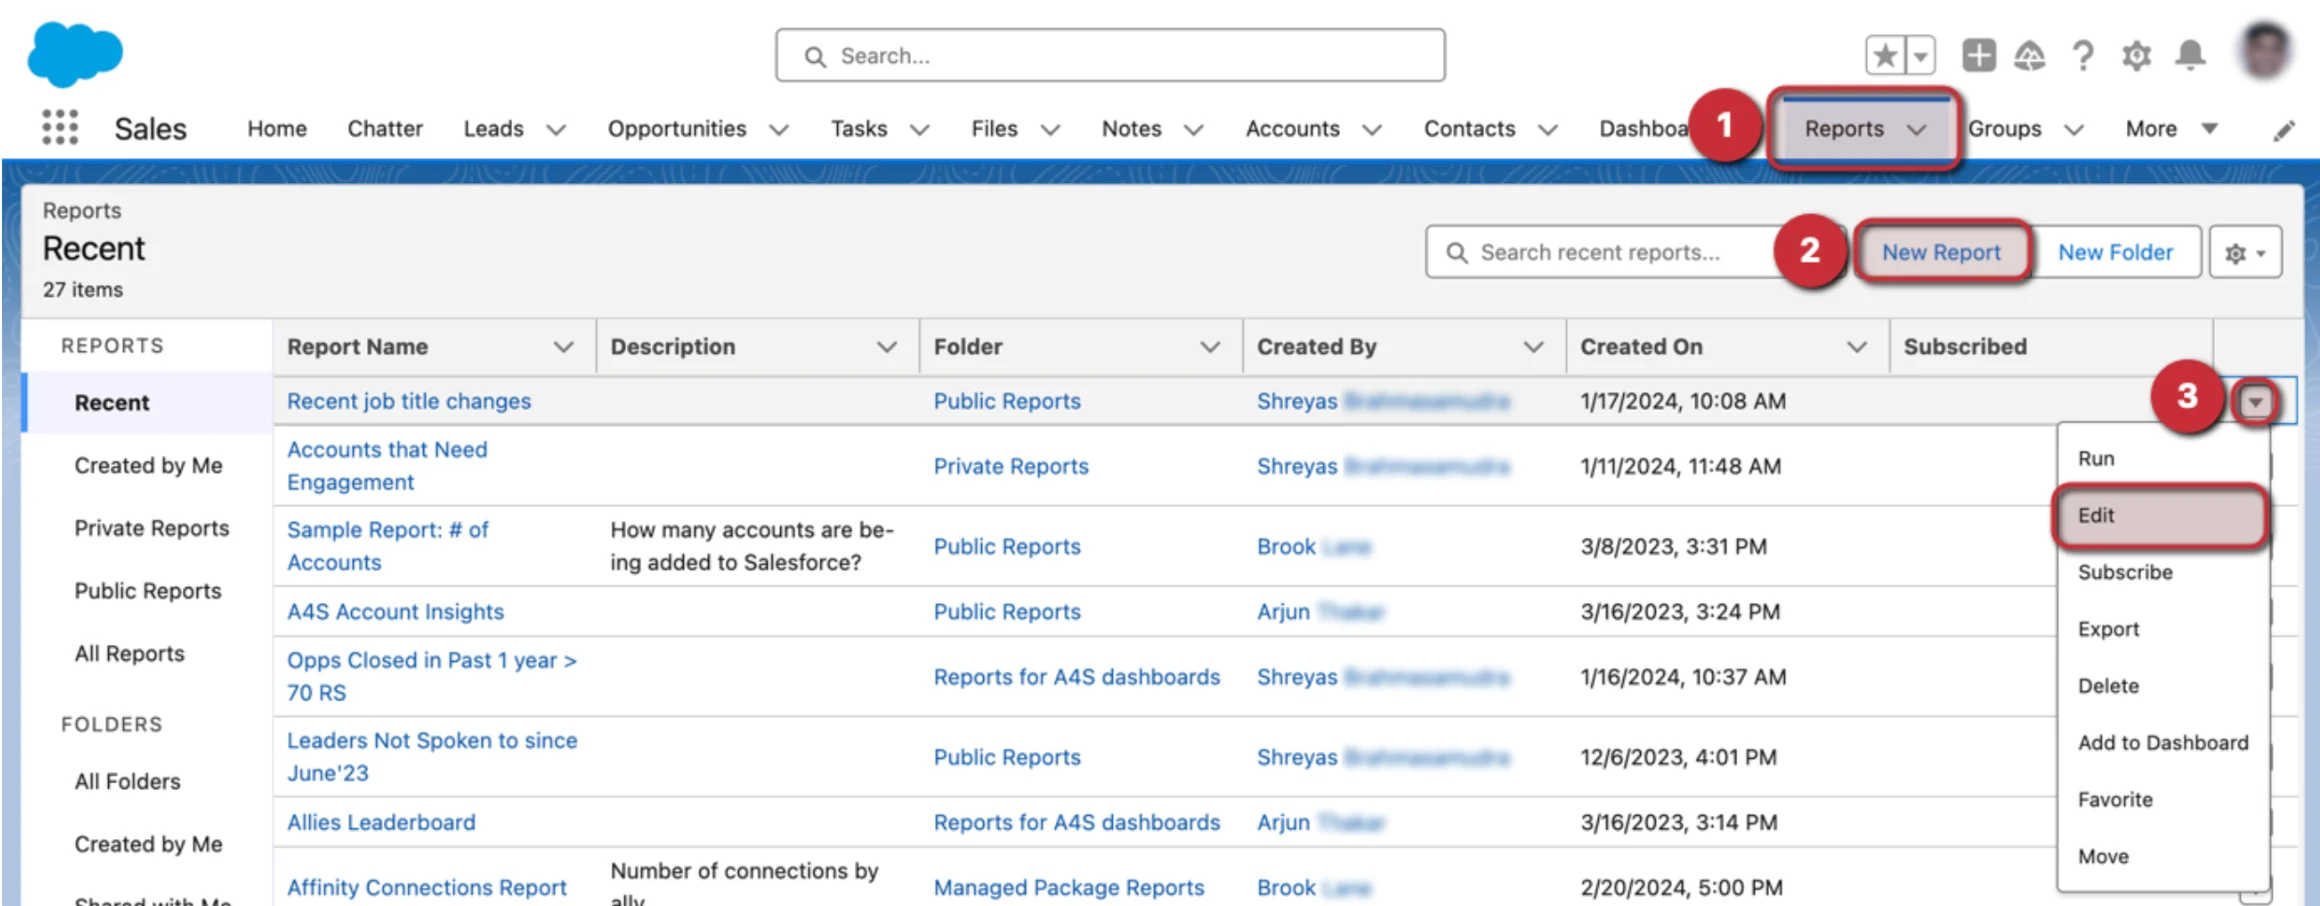
- To create a new report or edit an existing report, click on the Reports tab.
- From here, click on New Report to start a new report from scratch.
- You can also click the dropdown arrow next to an existing report that you’d like to Edit if you want to add/replace fields with the relevant Affinity Data fields or Email and Meeting Activity Data.
- Then, follow Report Examples 1-9 below.
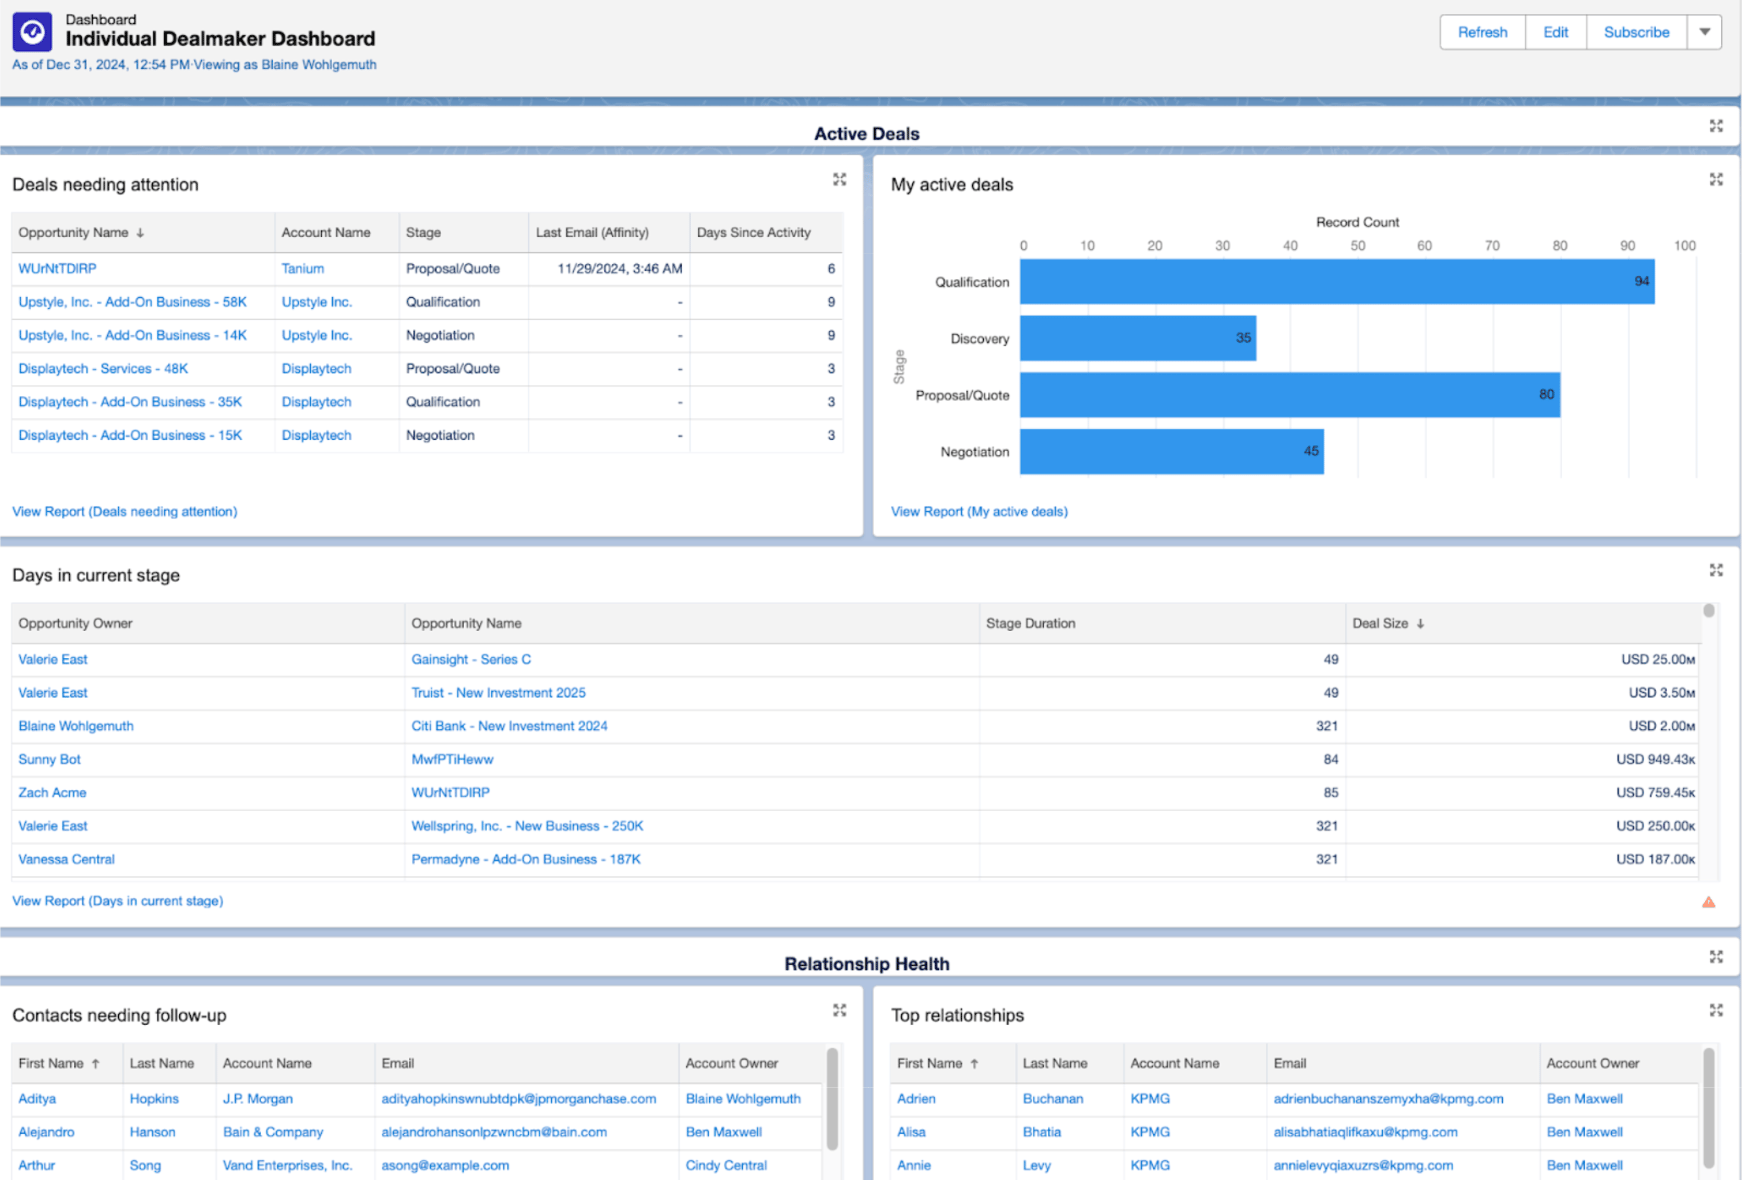
Report Example 1 - Deals needing attention
Highlights active deals that have gone 15 days or more without any recorded activity. This helps dealmakers identify which opportunities may be stalling and need immediate attention.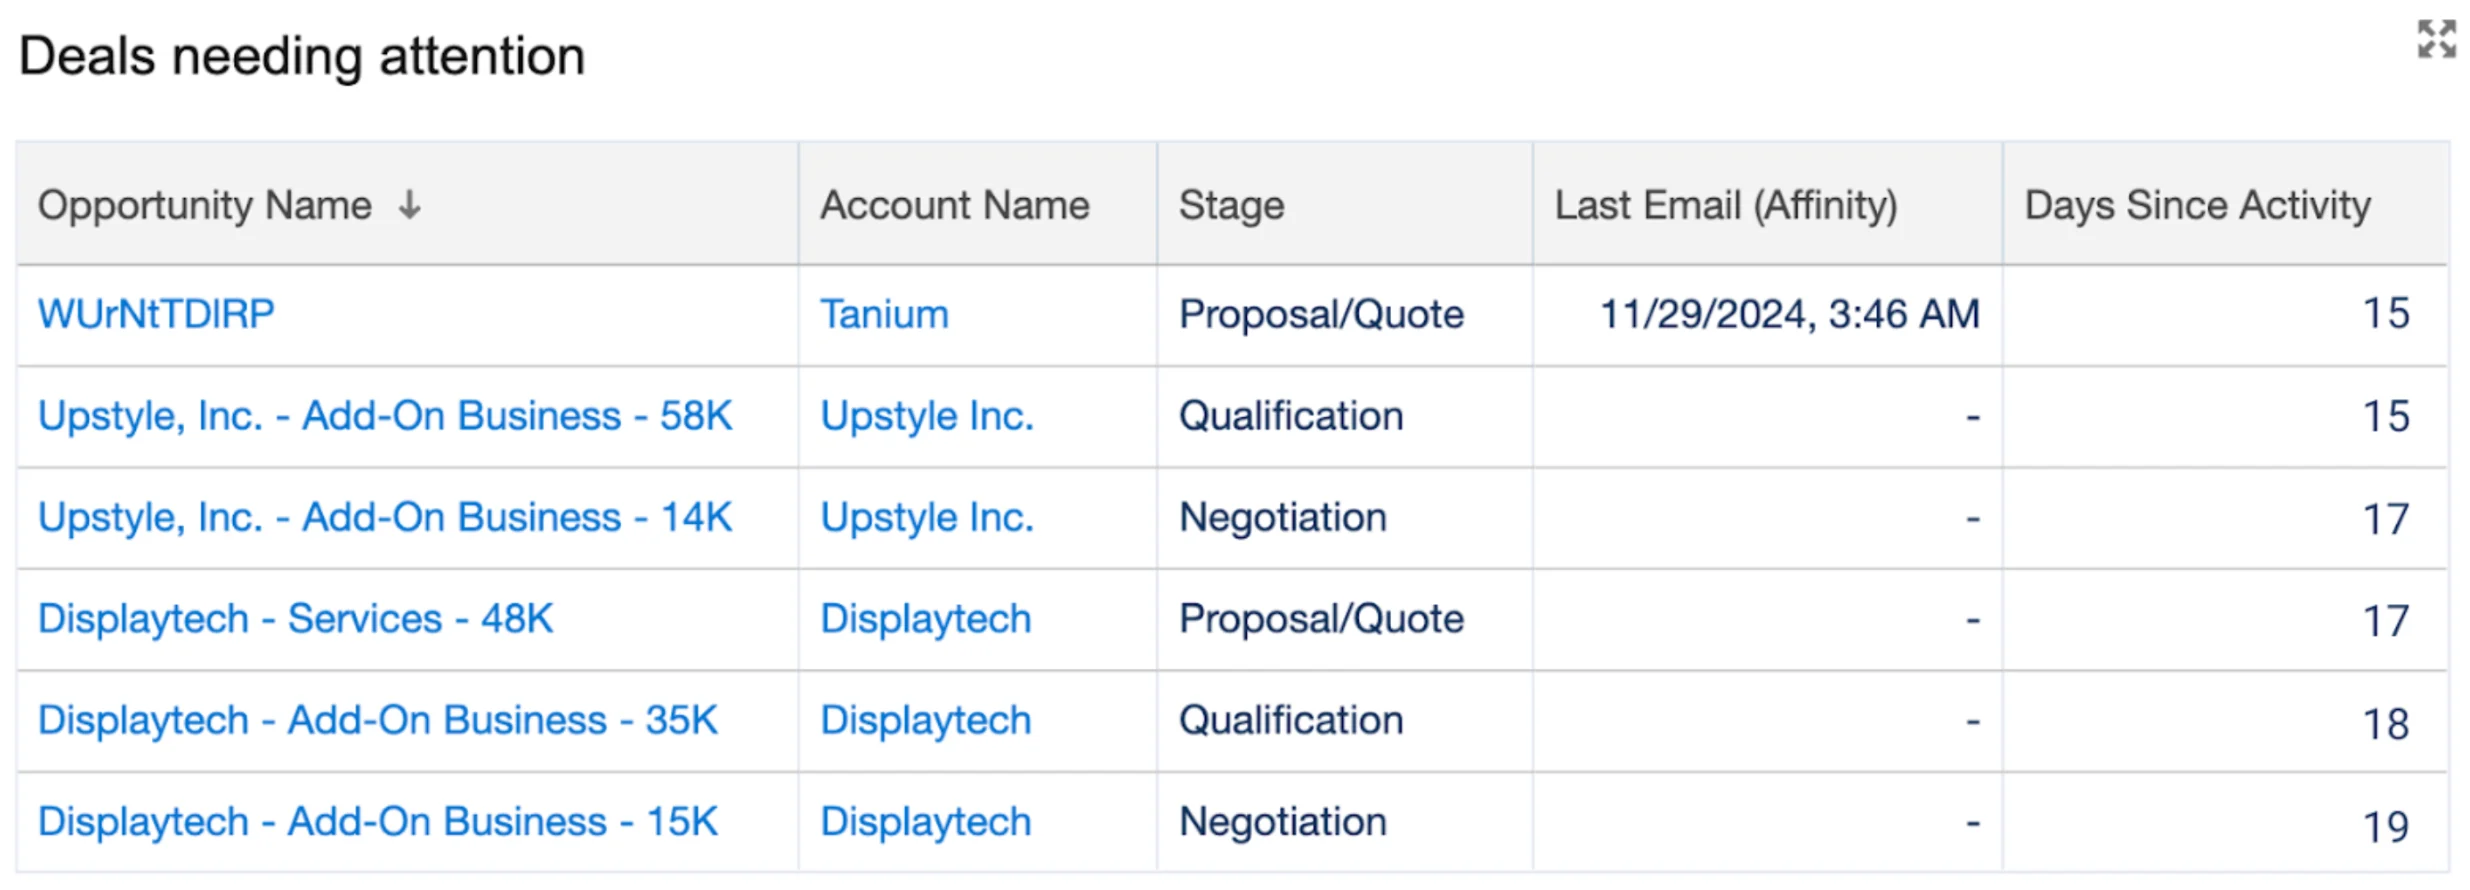
- Click New Report and select Opportunity as the Report Type.
- Add the following columns: Opportunity Name, Account Name, Stage, Last Email (Affinity), # Days Since Activity, # Expected Revenue, # Deal Size, Next Step.
- Add filters: Show Me: All Opportunities; Close Date: All Time; Territories: All; Opportunity Status: Open; Probability: All; Days Since Activity: greater than 15.
Report Example 2 - Active deals
Displays all open opportunities organized by stage, allowing dealmakers to quickly assess the current balance of their pipeline.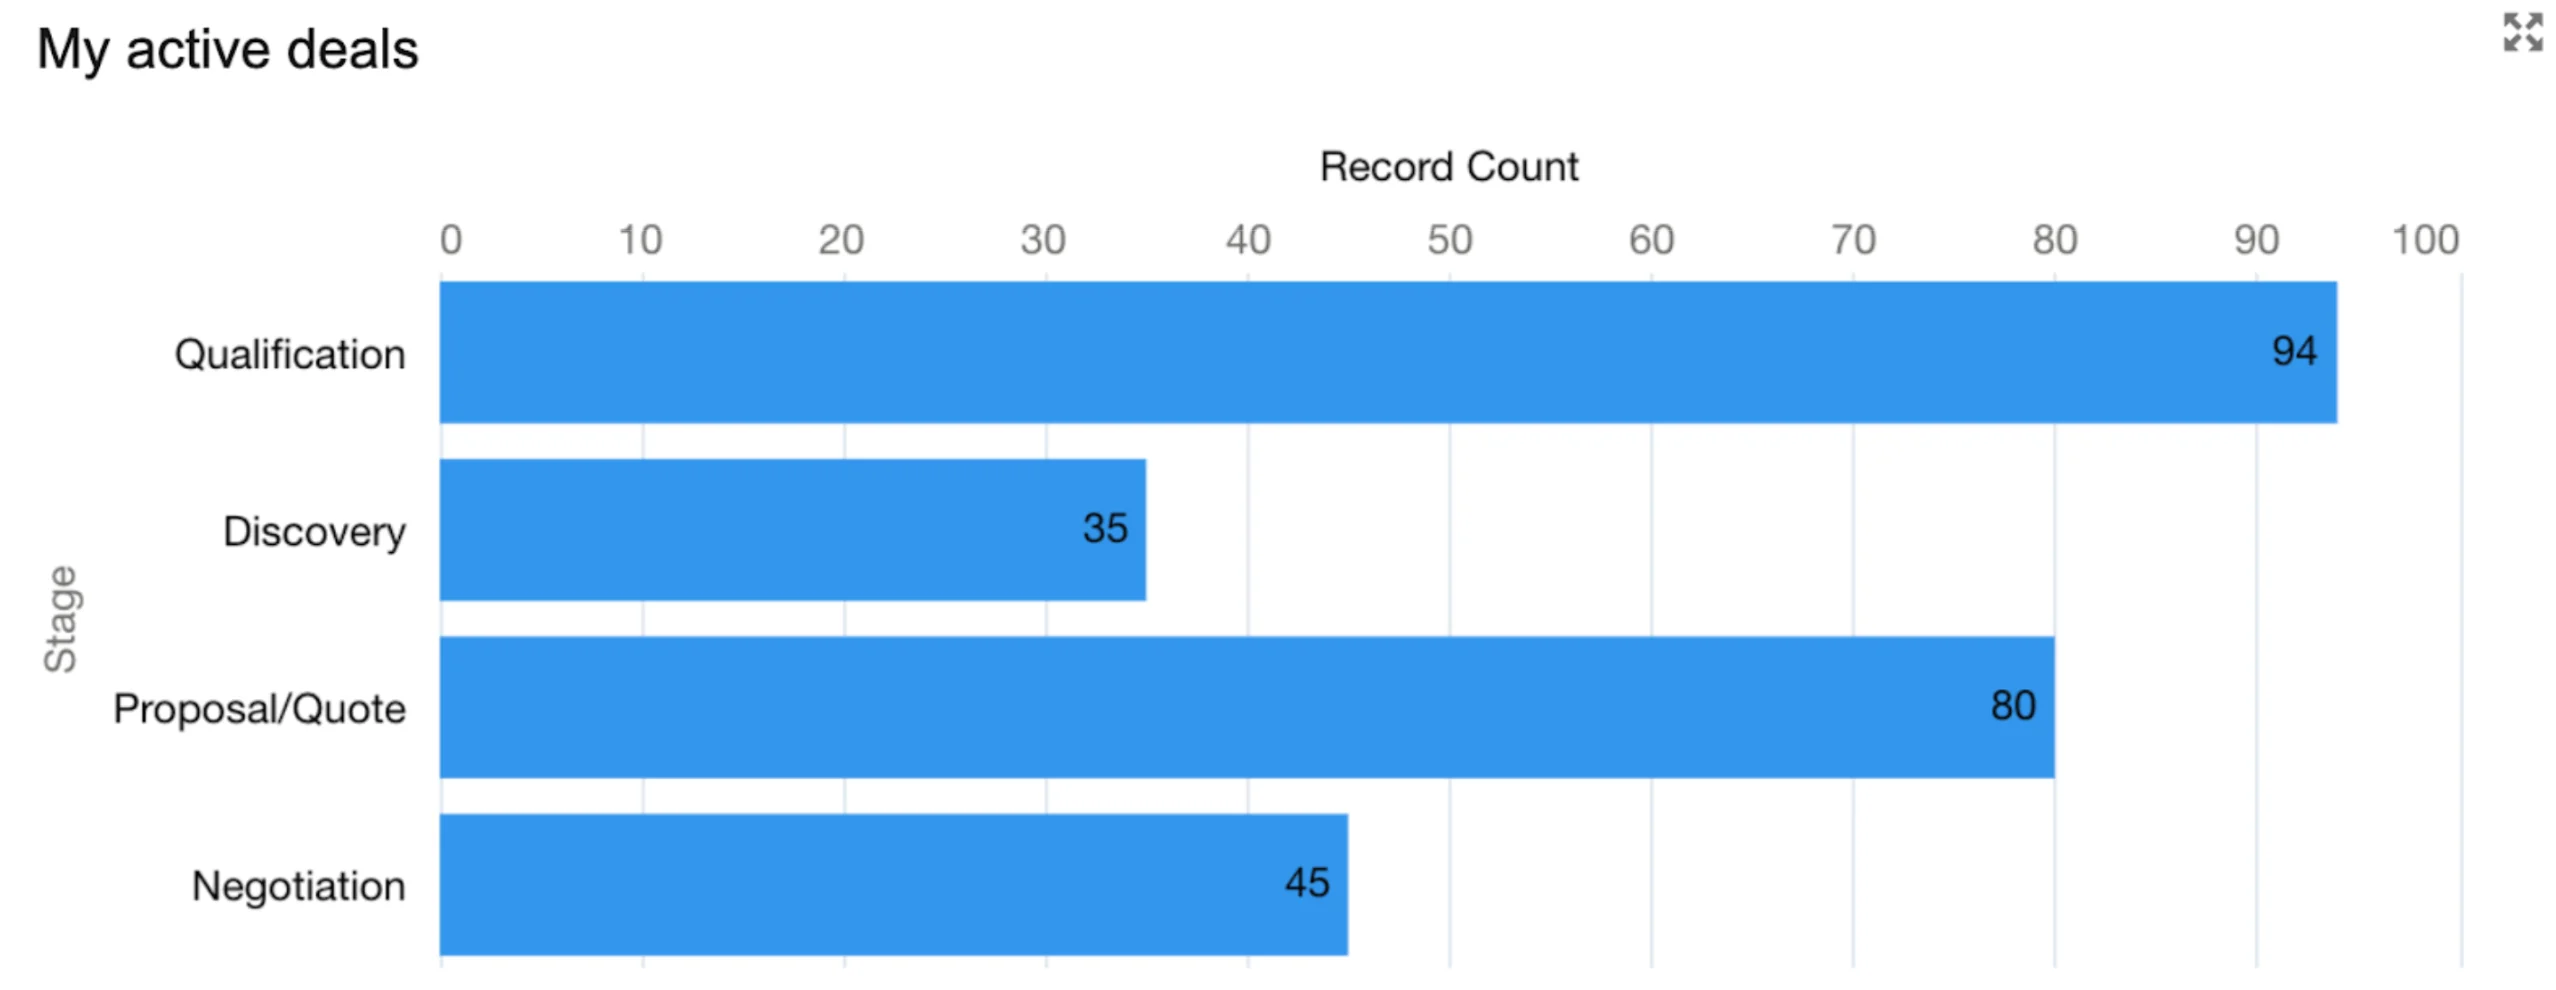
- Click New Report and select Opportunities as the Report Type.
- Group rows by Stage and add columns: Opportunity Owner, Account Name, Opportunity Name, Fiscal Period, # Deal Size, # Expected Revenue, # Probability (%), # Age, Close Date, Created Date, Next Step, Lead Source, Type.
- Add filters: Show Me: All Opportunities; Close Date: All Time; Territories: All; Opportunity Status: Open; Probability: All.
Report Example 3 - Days in current stage
This report tracks how long each deal has been at its current stage, helping dealmakers spot potential bottlenecks and determine where to apply extra attention or resources. A summary of this report can also help leadership identify areas of improvement for deal progression during post-mortems.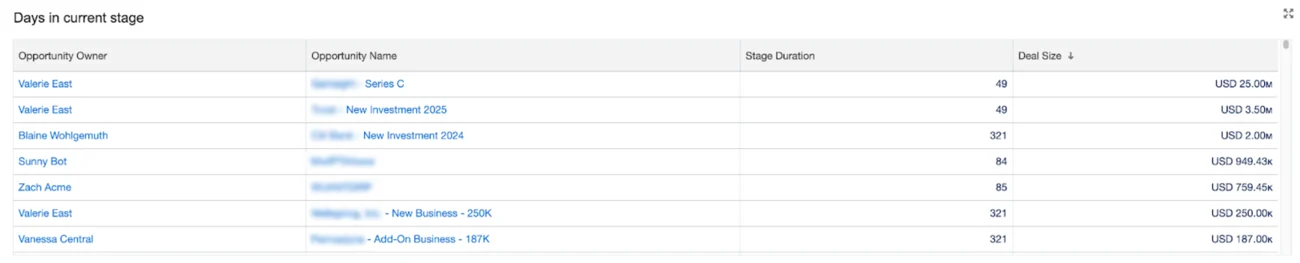
- Click New Report and select Opportunities as the Report Type.
- Group rows by Stage and add columns: Opportunity Owner, Opportunity Name, Account Name, # Stage Duration, # Deal Size, Type.
- Finally, add filters: Show Me: All Opportunities, Close Date: All Time, Territories: All, Opportunity Status: Open, Probability: All. You can optionally add a stage duration
Report Example 4 - Contacts needing follow-up
Identifies contacts who have declining relationship scores. This report prompts dealmakers to re-engage these individuals and maintain strong business connections. We recommend keeping relationship scores above 70, but you can determine what works best for your firm.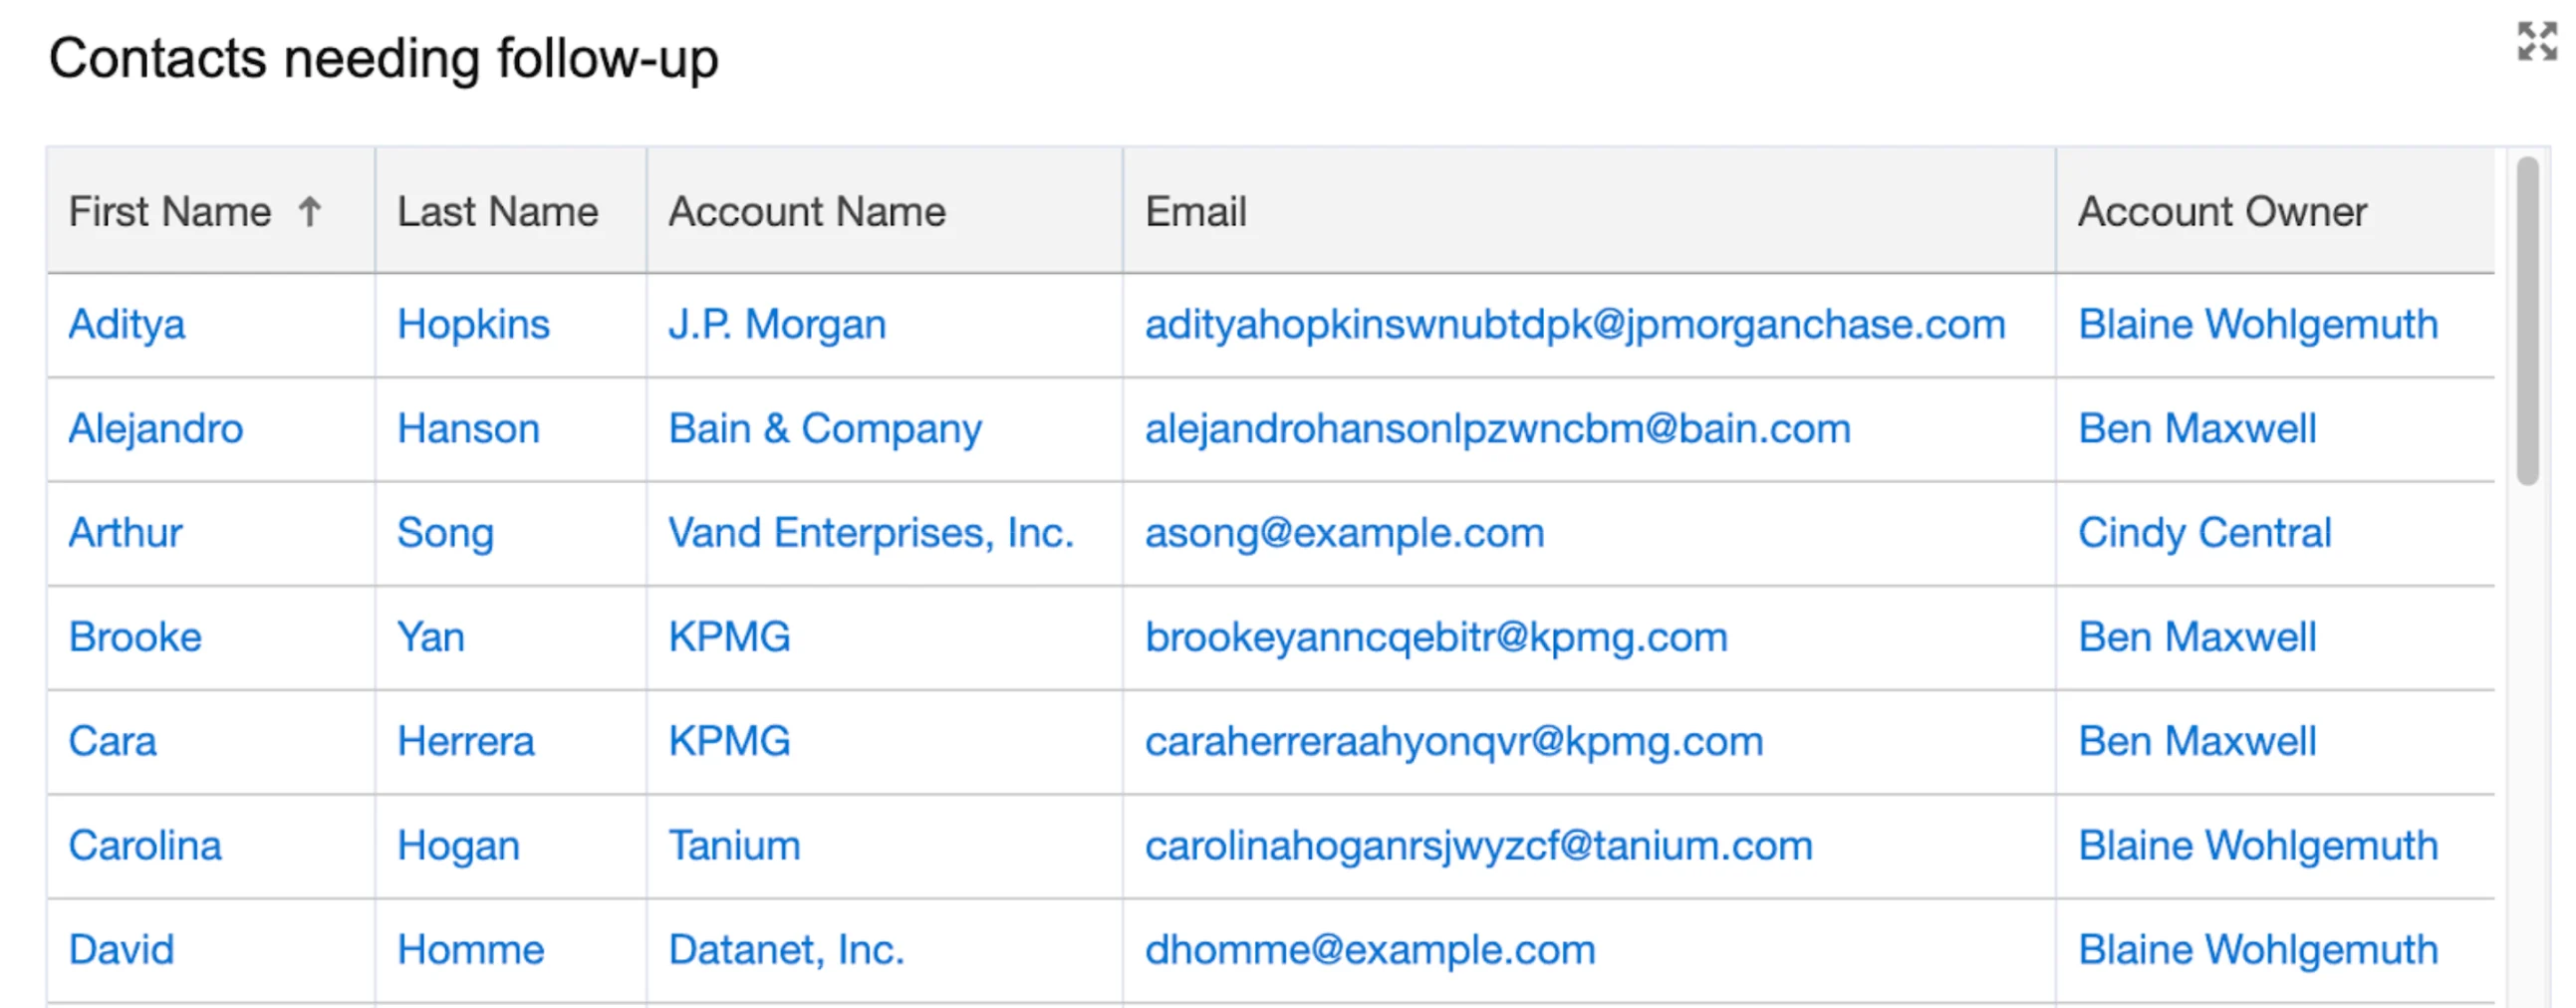
- Click New Report and select Contacts & Accounts as the Report Type.
- Add columns: First Name, Last Name, Account Name, Email, Account Owner, # Highest Relationship Score, # Total Deal Amount.
- Add filters: Show Me: My Contacts; Created Date: All Time; Highest Relationship Score: less or equal 70; Total Deal Amount: not equal to $0.
Report Example 5 - Top relationships
Surfaces contacts with a high relationship score (e.g. greater than 80), enabling dealmakers to focus on their strongest and most valuable connections. This ensures they allocate time and resources efficiently to maintain their best relationships.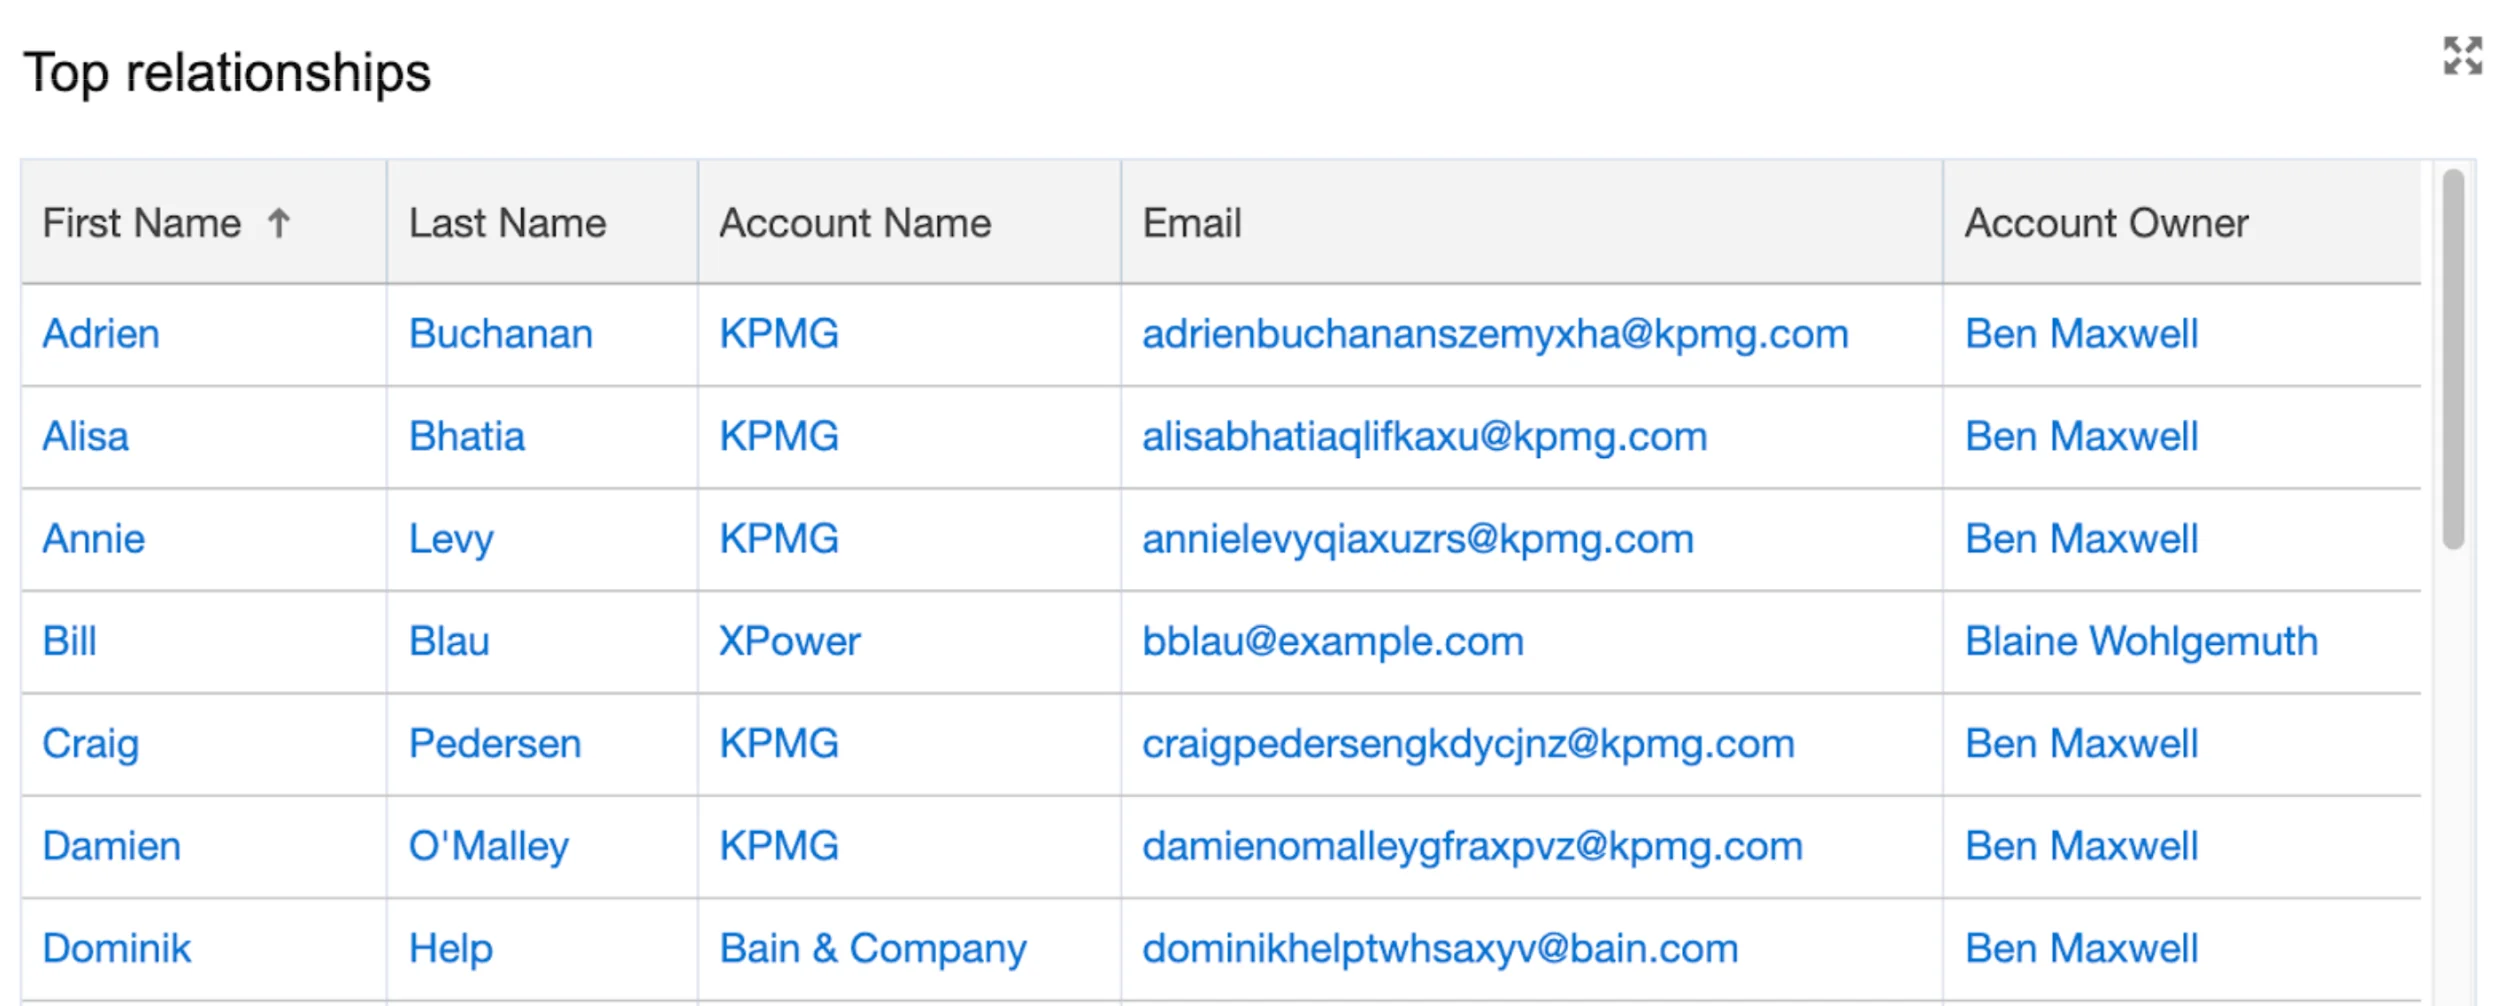
- Click New Report and select Contacts & Accounts as the Report Type.
- Add columns: First Name, Last Name, Account Name, Email, Account Owner, # Highest Relationship Score, # Total Deal Amount.
- Add filters: Show Me: My contacts; Created Date: All Time; Highest Relationship Score: greater or equal 80; Total Deal Amount: not equal to $0.00.
Report Example 6 - First meetings this month
This report displays all initial meetings booked during the current month. It provides dealmakers with insights into their deal origination efforts and helps them understand how well new outreach strategies are performing.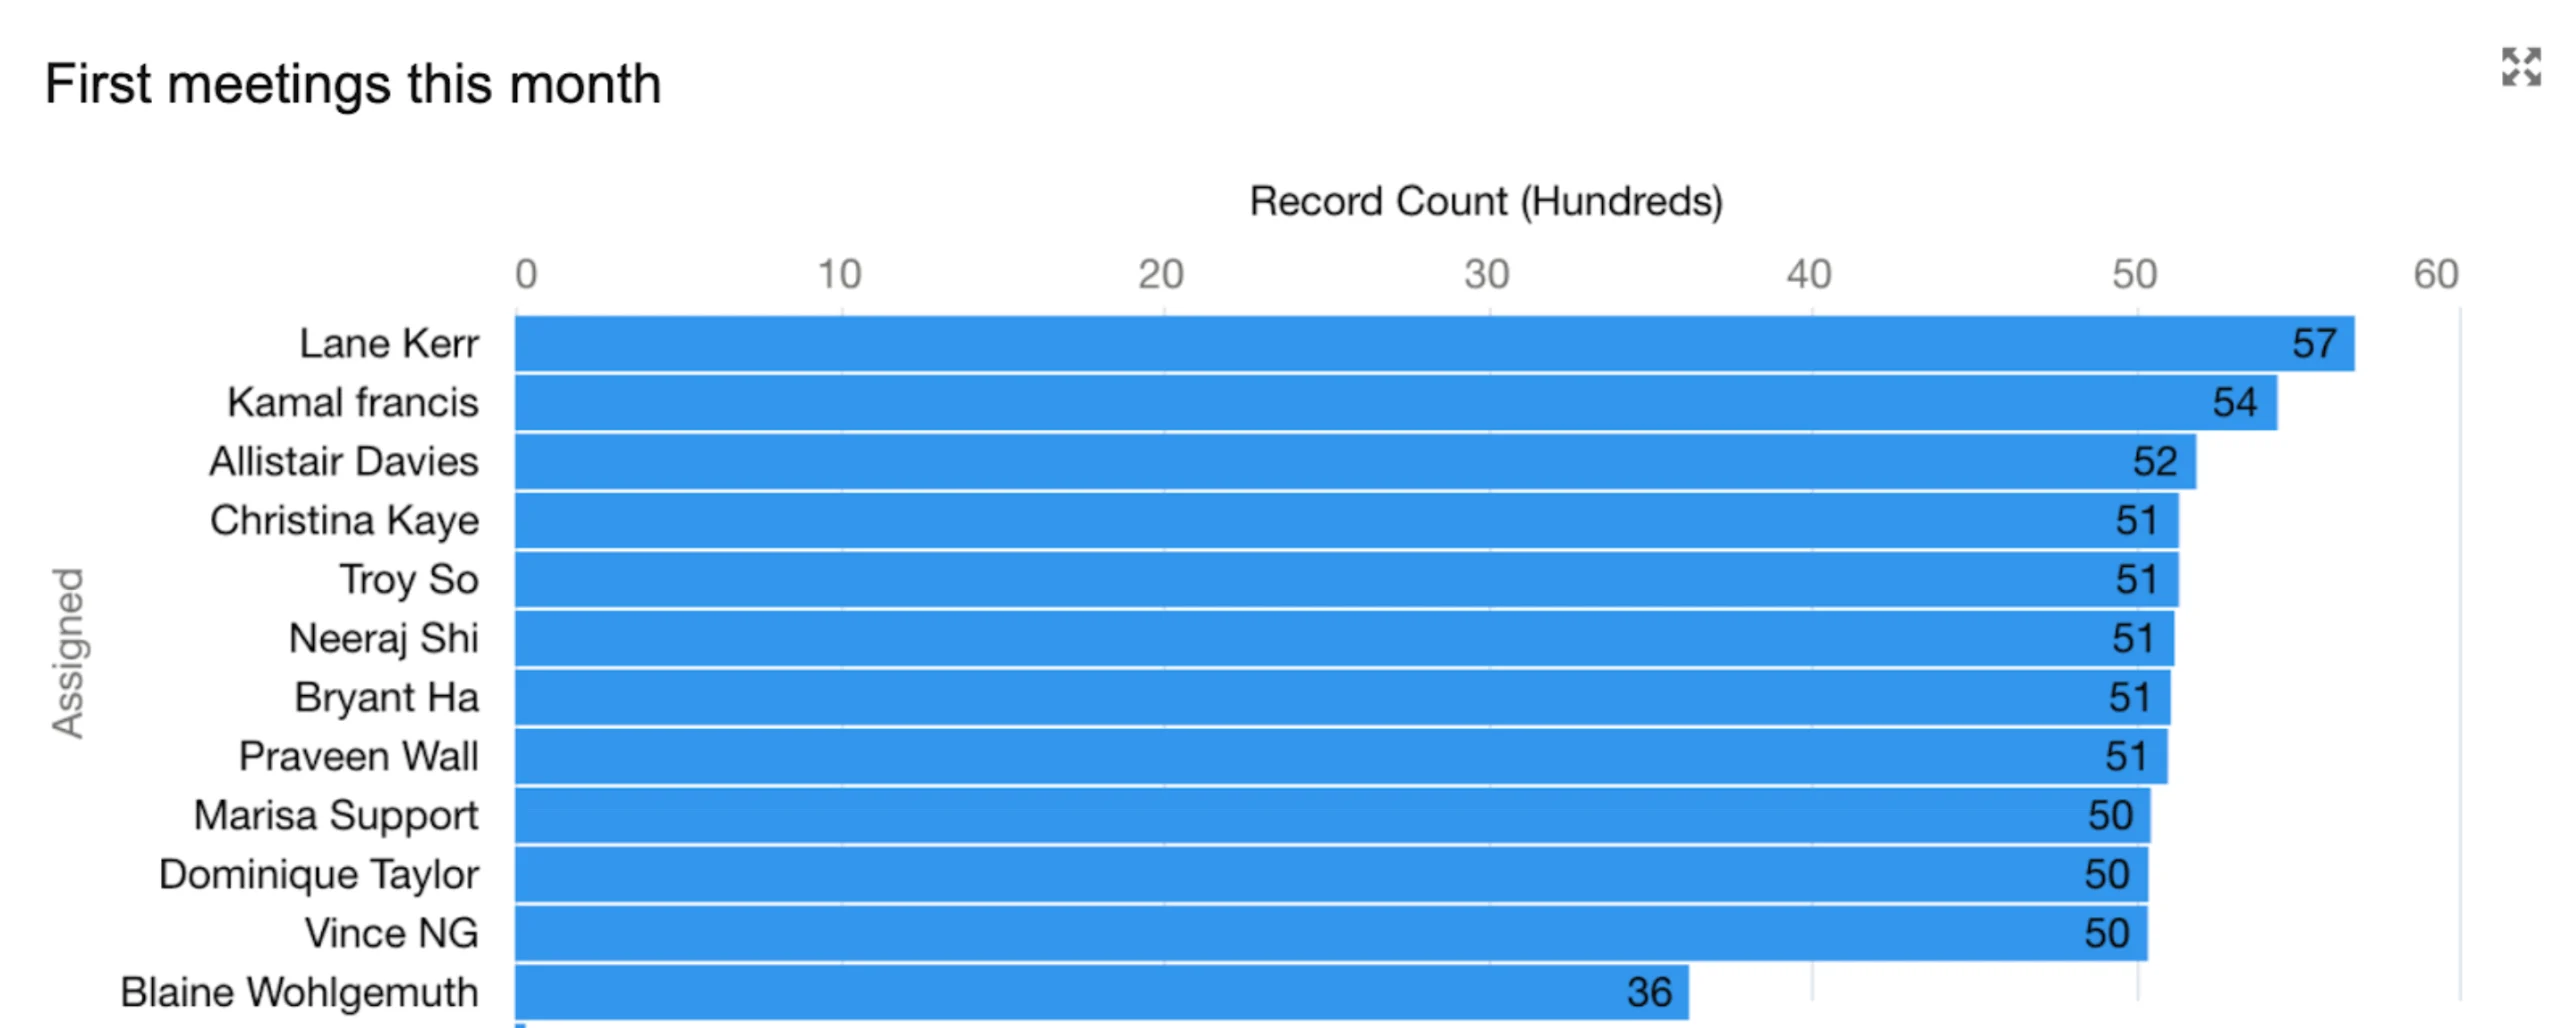
- Click New Report and select Activities with Contacts as the Report Type.
- Group rows by Stage and add columns: Subject, First Name, Last Name, Type, Account Type.
- Add filters: Show Me: All activities; Date: All Time; Show: Completed Activities; Show: Tasks and Events; Type: equals Meeting.
Report Example 7 - Recent leadership changes
Highlights contacts who have recently experienced leadership or role changes. This enables dealmakers to understand shifts in influence or decision-making power and adjust their engagement strategies accordingly. This report also provides a proactive tool for dealmakers to uncover opportunities with familiar contacts who have moved to new firms.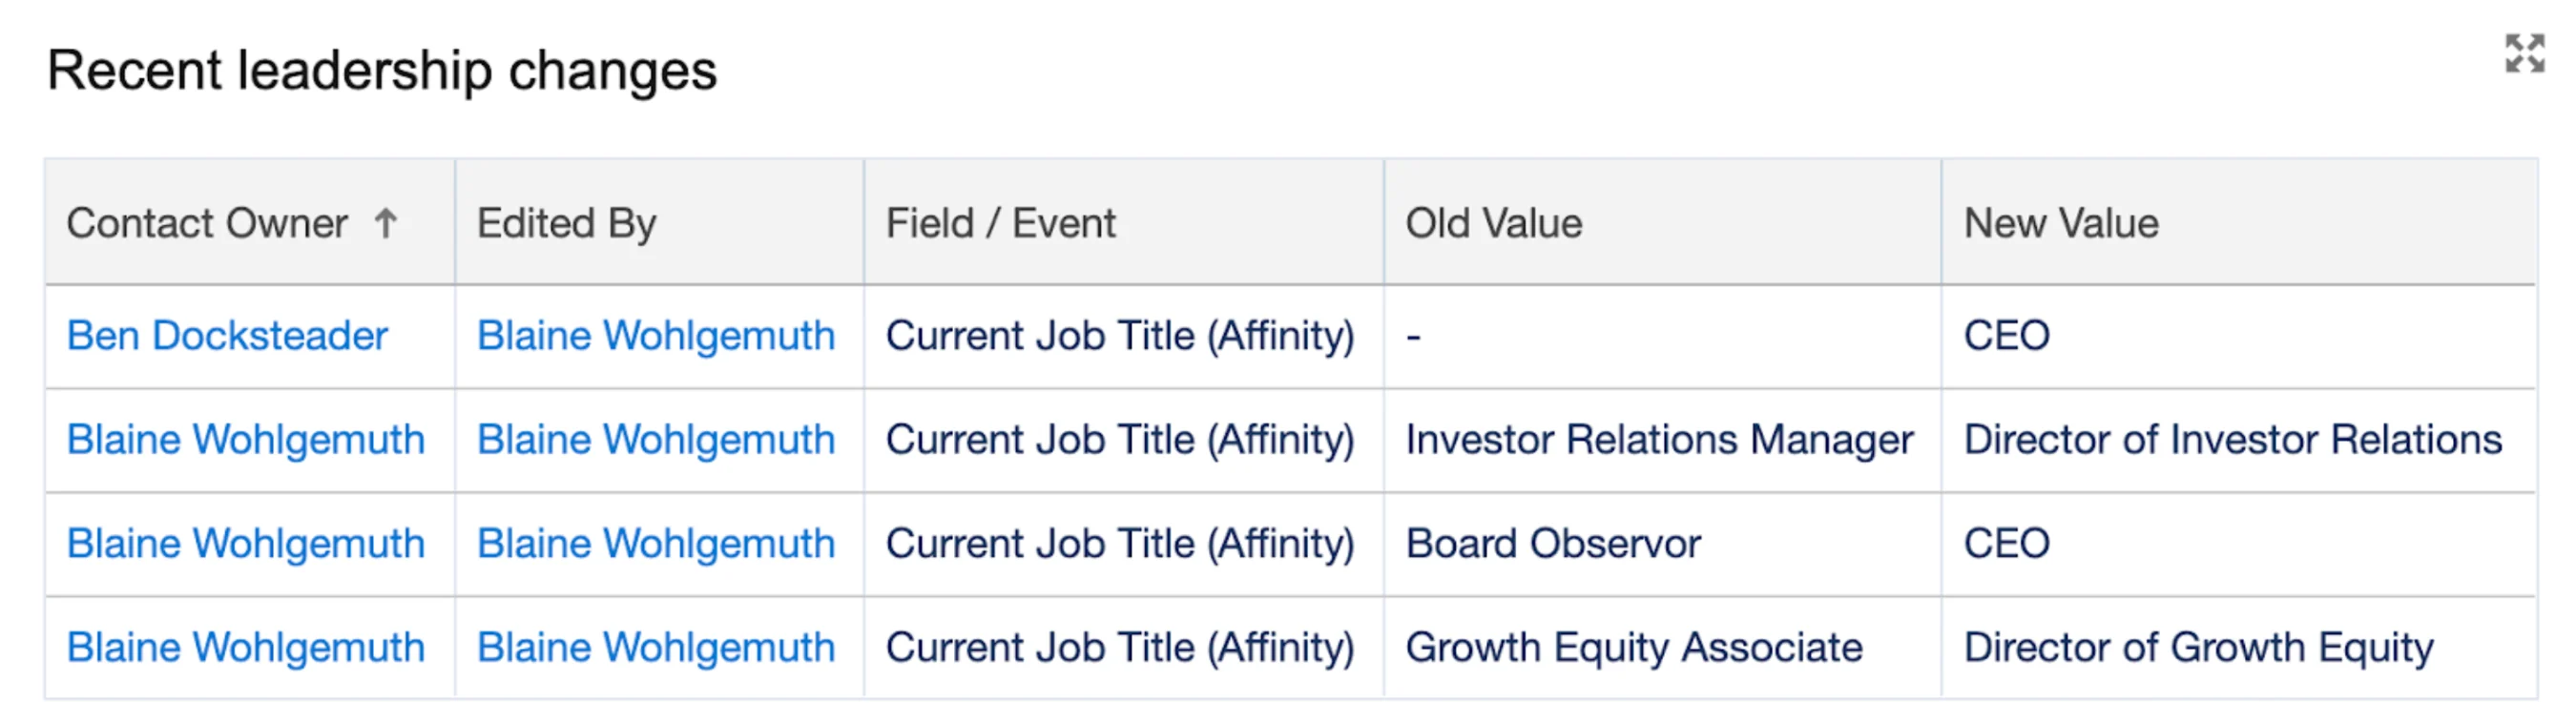
- Click New Report and select Contact History as the Report Type.
- Group rows by Account Name and add columns: Contact Owner, Edited By, Field / Event, Old Value, New Value, Edit Date, First Name, Last Name.
- Add filters: Show Me: All accounts; Edit Date: All Time; Field / Event: equals Current Job Title (Affinity).
Report Example 8 - Meeting activity trend
Shows the volume of meetings over time, allowing dealmakers to monitor engagement trends, identify seasonal patterns, and fine-tune their outreach cadence.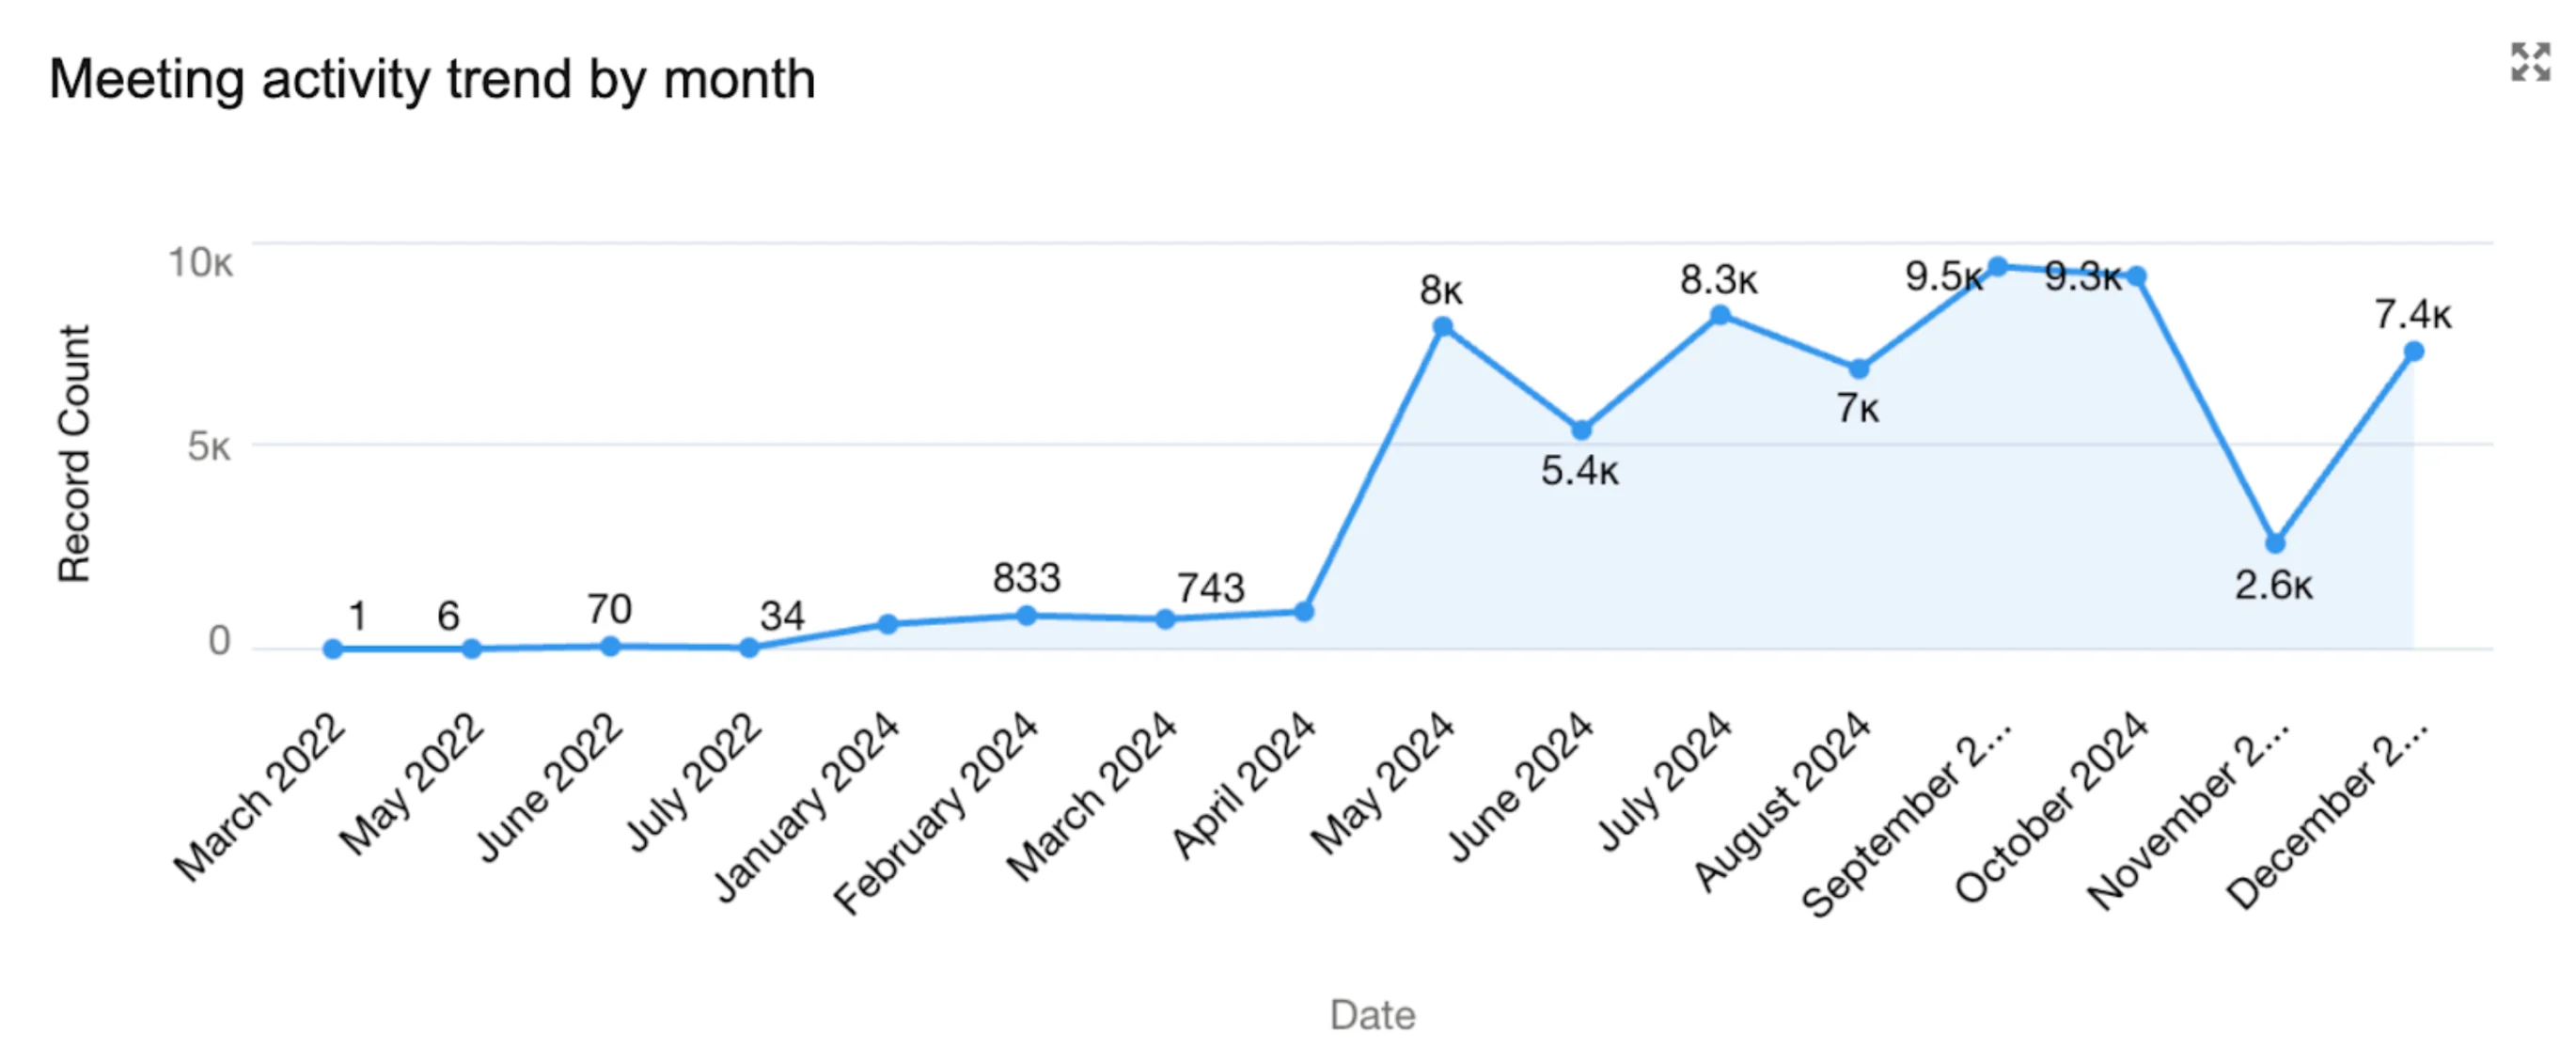
- Click New Report and select Activities with Contacts as the Report Type.
- Group rows by Date and add columns: Subject, First Name, Last Name, Type, Account Type, Assigned.
- Add filters: Show Me: All activities; Date: All Time; Show: Completed Activities; Show: Tasks and Events; Type: equals Meeting.
Report Example 9 - Industry coverage distribution
Breaks down closed won opportunities by industry, giving dealmakers insight into which sectors they’re actively covering, areas for expansion, and where to strategically focus their efforts to deliver the greatest impact.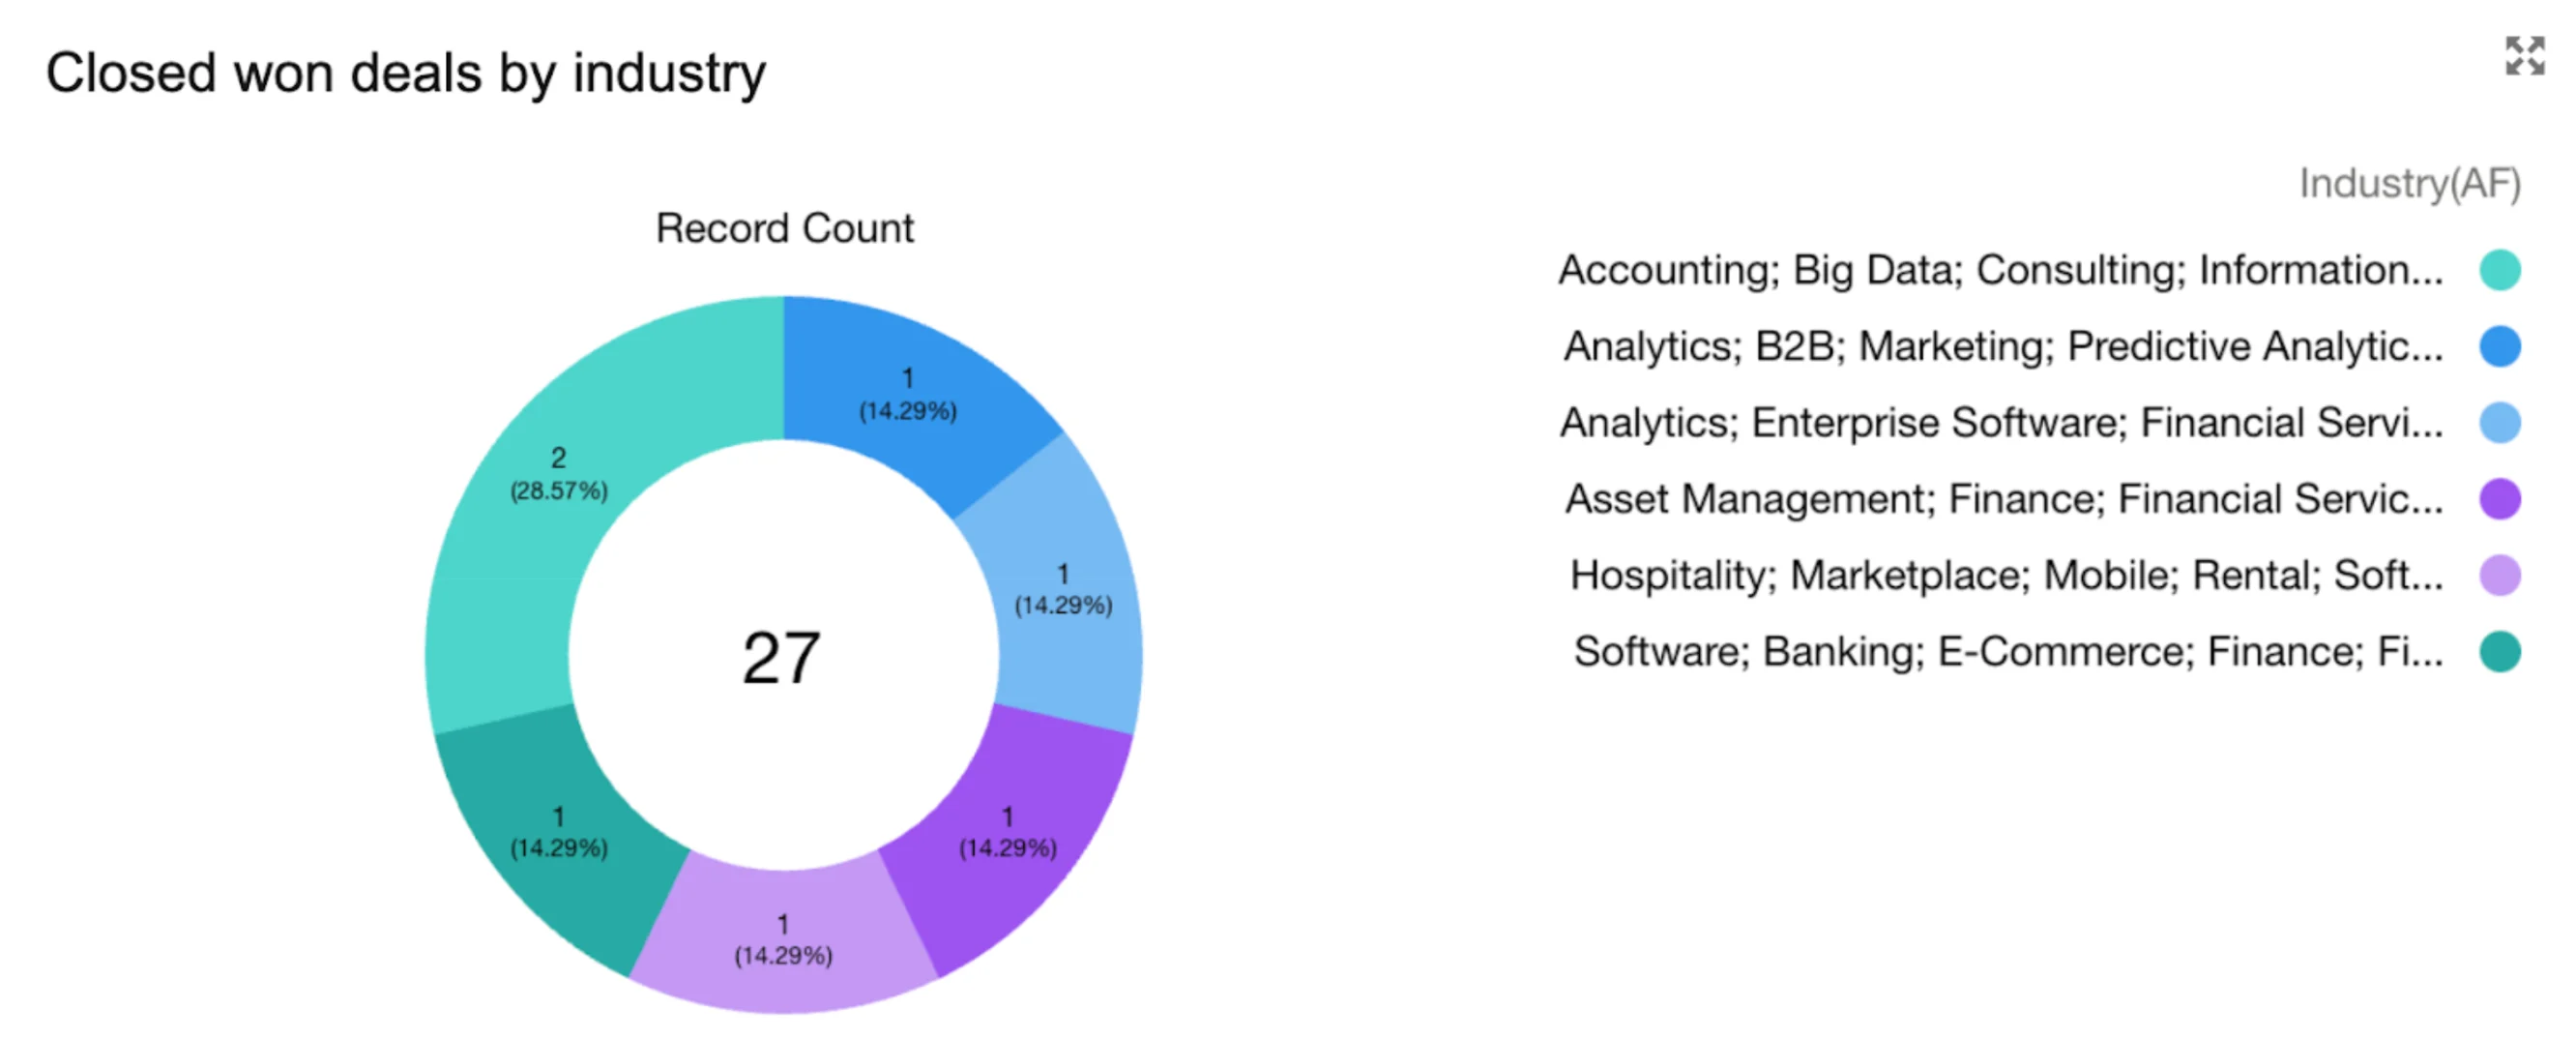
- Click New Report and select Opportunities as the Report Type.
- Group rows by Industry(AF) and add columns: Opportunity Name, Stage, Fiscal Period, # Deal Size, # Expected Revenue, # Probability (%), # Age, Close Date, Created Date, Next Step, Lead Source.
- Add filters: Show Me: All opportunities; Closed Date: All Time; Territories: All; Opportunity Status: Any; Probability: All.
Step 2. Build your dashboard
- Navigate to the Dashboards tab and click New Dashboard.
- Name the dashboard and optionally add a short description. Then, place the dashboard in the desired folder.
- Click + Widget to add a widget to the dashboard.
- Choose a source report for the widget, then click Select.
- Customize how the widget displays data, then click Add. Arrange and resize the widget as necessary.
- Repeat this step until you have added all desired widgets.
- Once the charts are in, you can optionally enhance the Dashboard with images and text.
- Update the dashboard properties to adjust View Dashboard As settings.
- By default, this is set to the person creating the Dashboard, but it can be changed at any point in time.
- If you are building this dashboard for another user, select the option titled Another person and search for the appropriate user. Then, click Save. When you have finished adding widgets and customizing your dashboard, click Save, then click Done.