> ## Documentation Index
> Fetch the complete documentation index at: https://support.affinity.co/llms.txt
> Use this file to discover all available pages before exploring further.
# Affinity Analytics List Summary Reports
> Help center reference
**Reference** — lookup information.
With List Summary Reports, you can quickly gain a high-level overview of different metrics and trends based on the data within a list.
**Note**: This video contains the old navigation bar on the top, whereas the current navigation bar now lies on the left side of your screen. While the remaining content is still the same, rest assured that we will be updating our videos accordingly.
## How to create a List Summary Report using the template
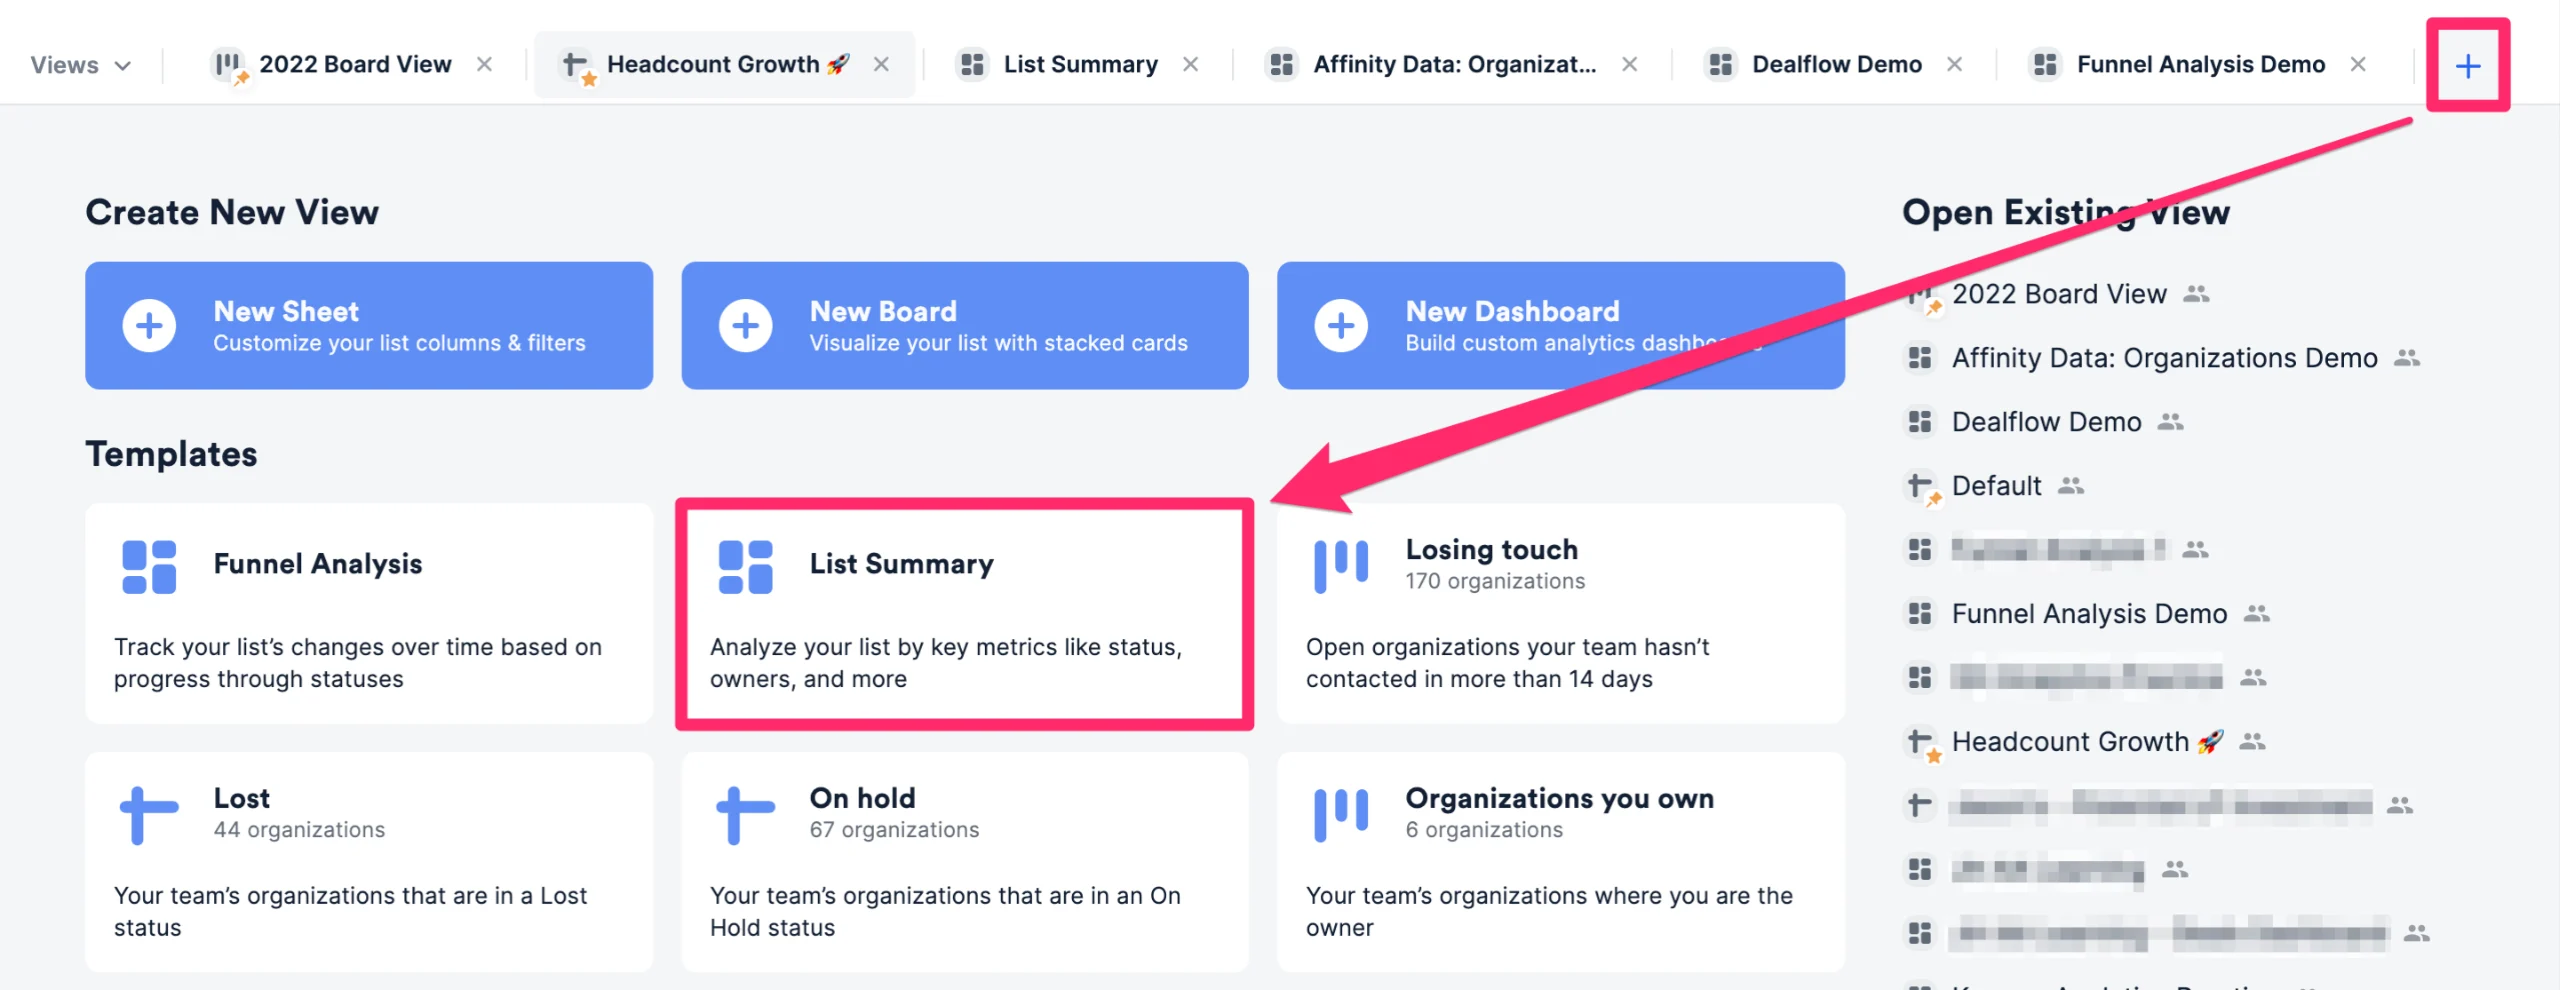
1. First, click into the list you'd like to report on, then click the **+** icon as shown below. Then, click the **List Summary** template option to create a new dashboard view.
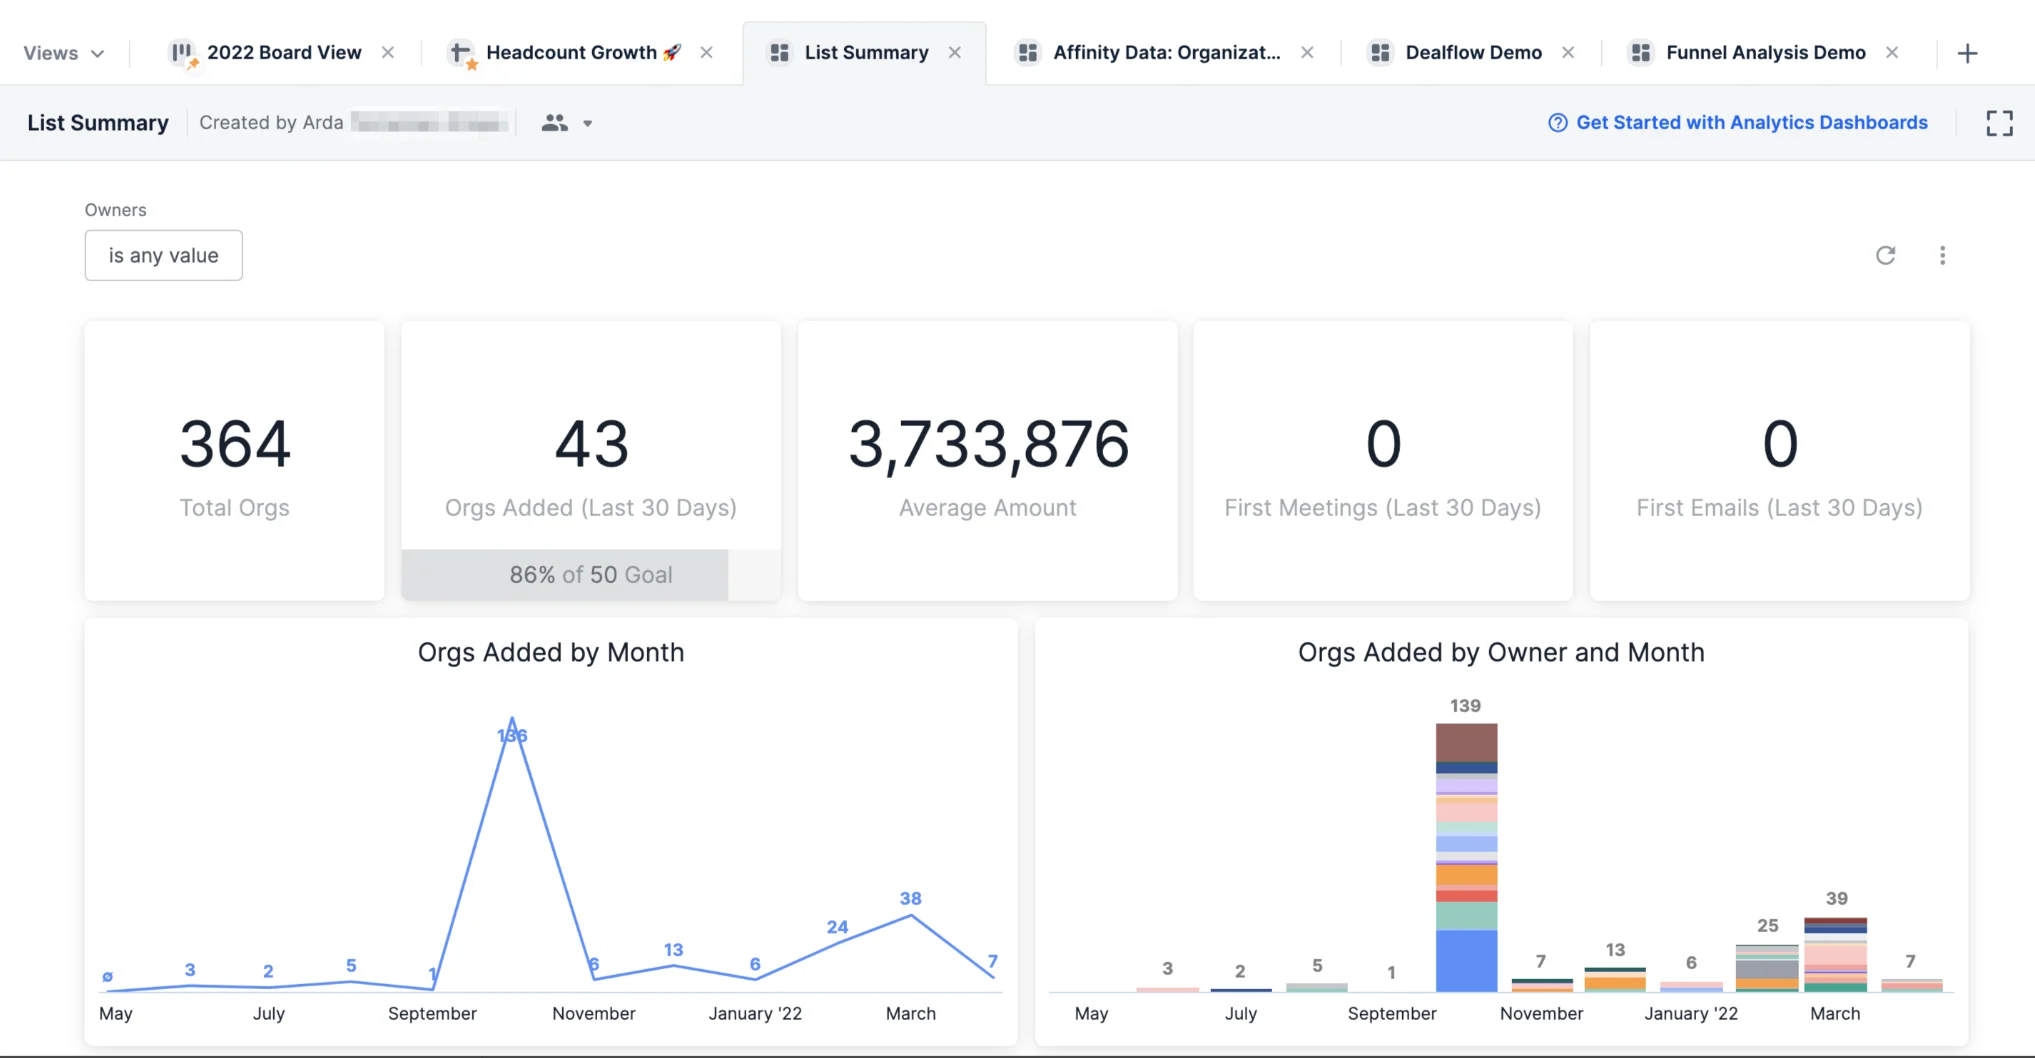
 2. Once the **List Summary** report is generated, you will immediately see different visualization tiles and metrics based on the data within this list.
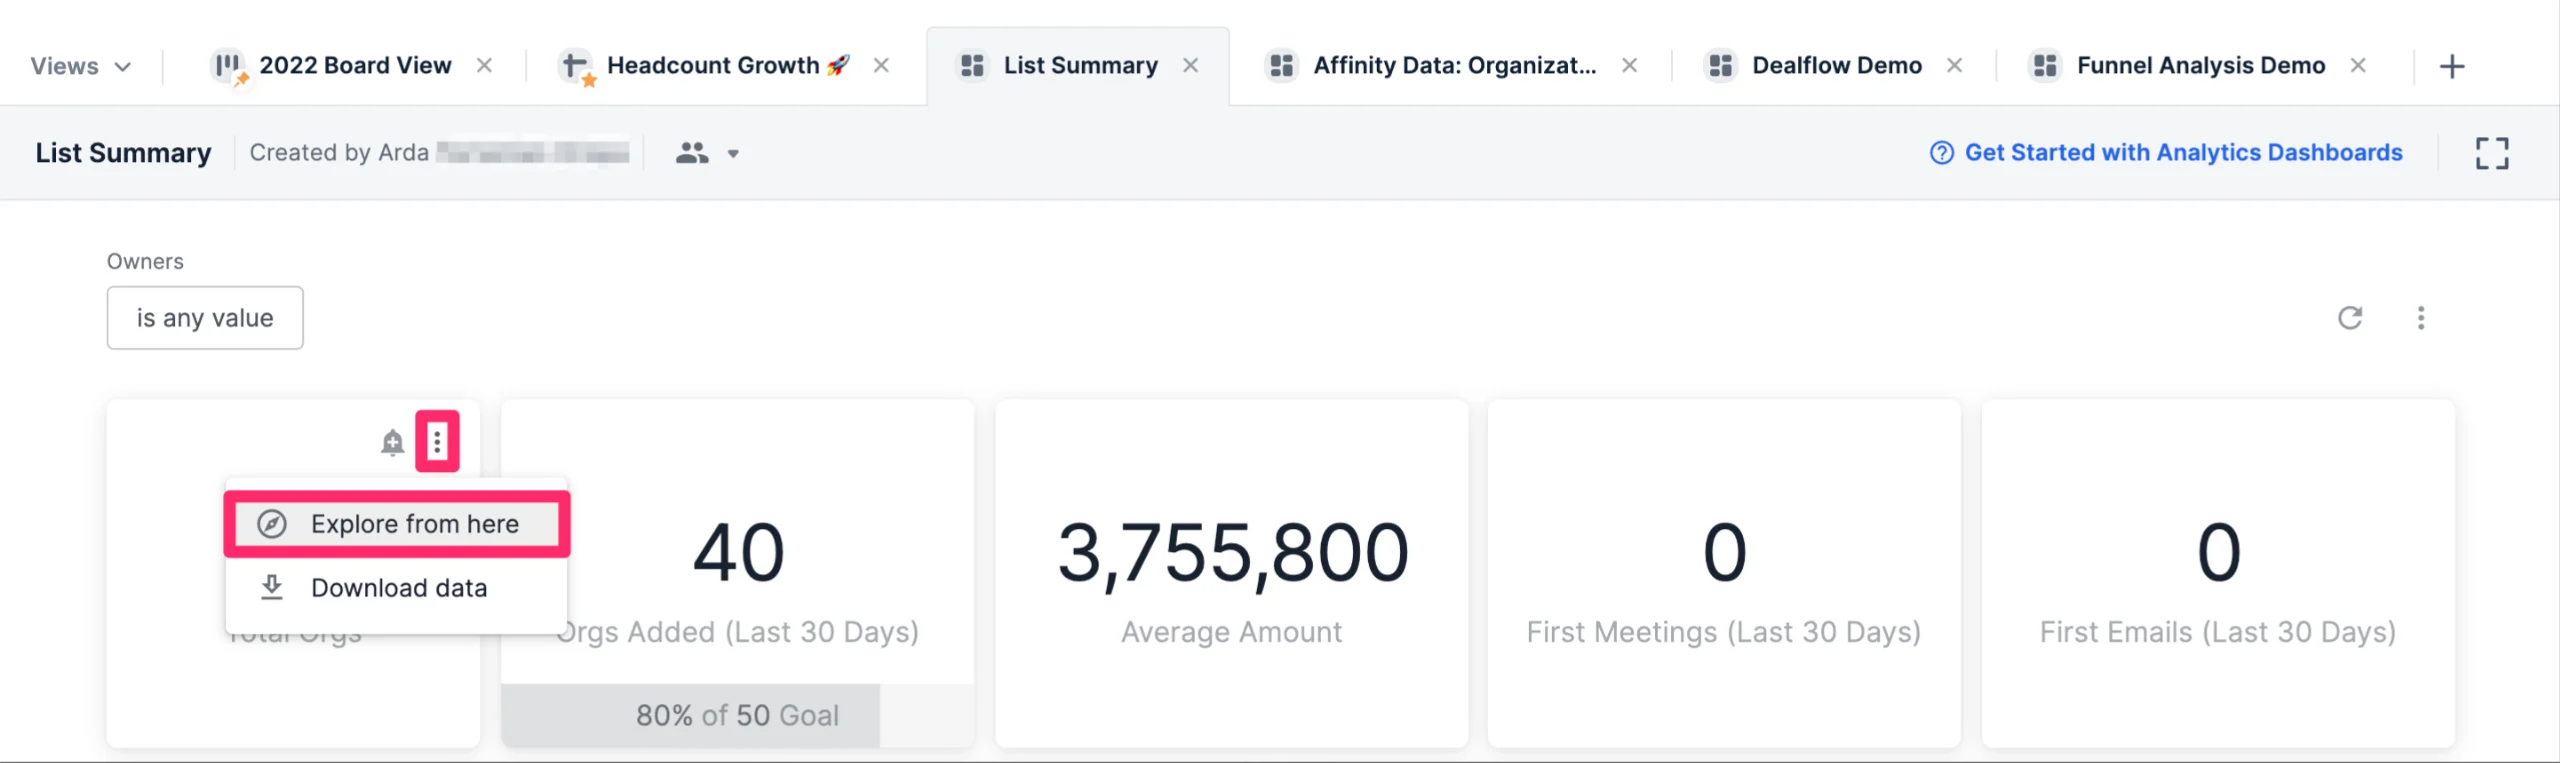
 3. Want to understand how certain visualization tiles were generated? Click the ellipsis (3-dotted icon) on the top-right corner of the visualization tile you want to dig deeper into, then click **Explore from here**.
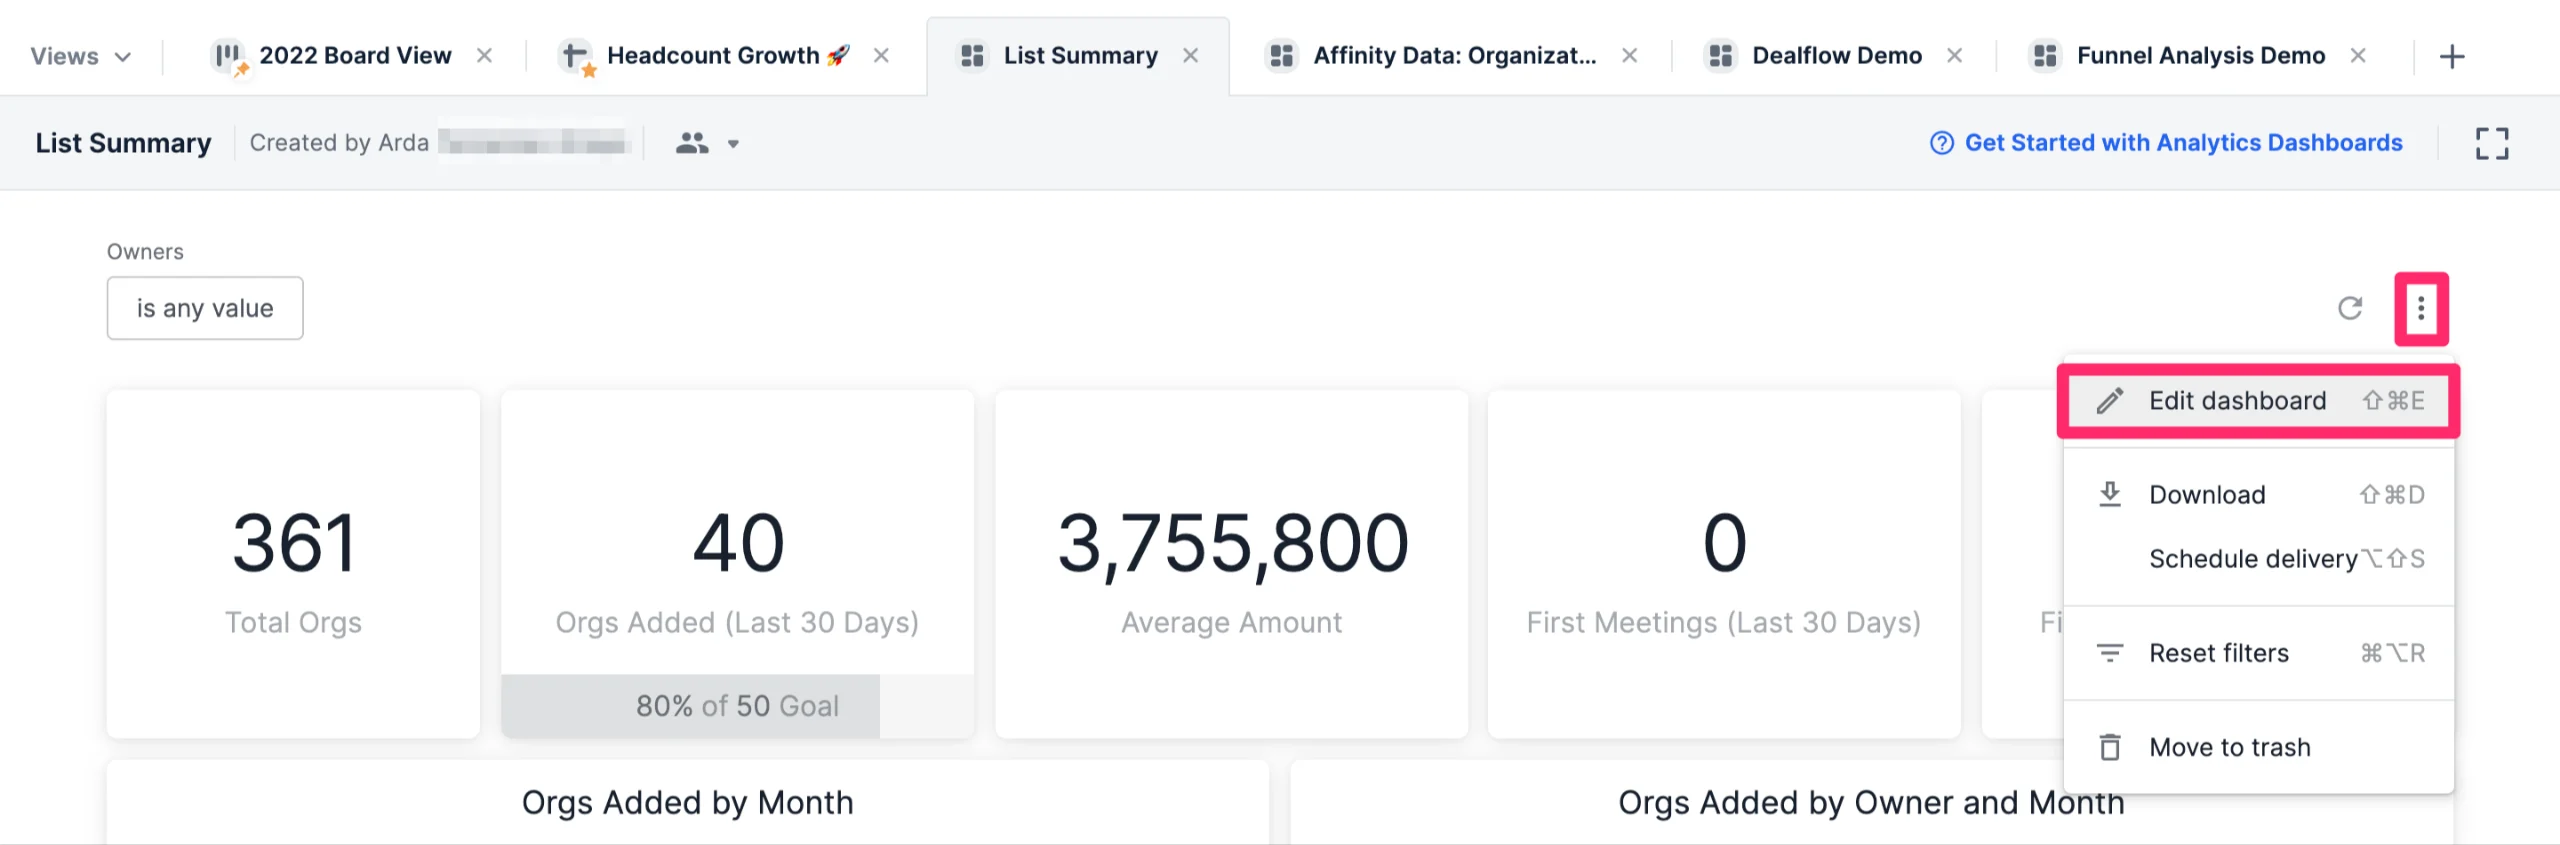
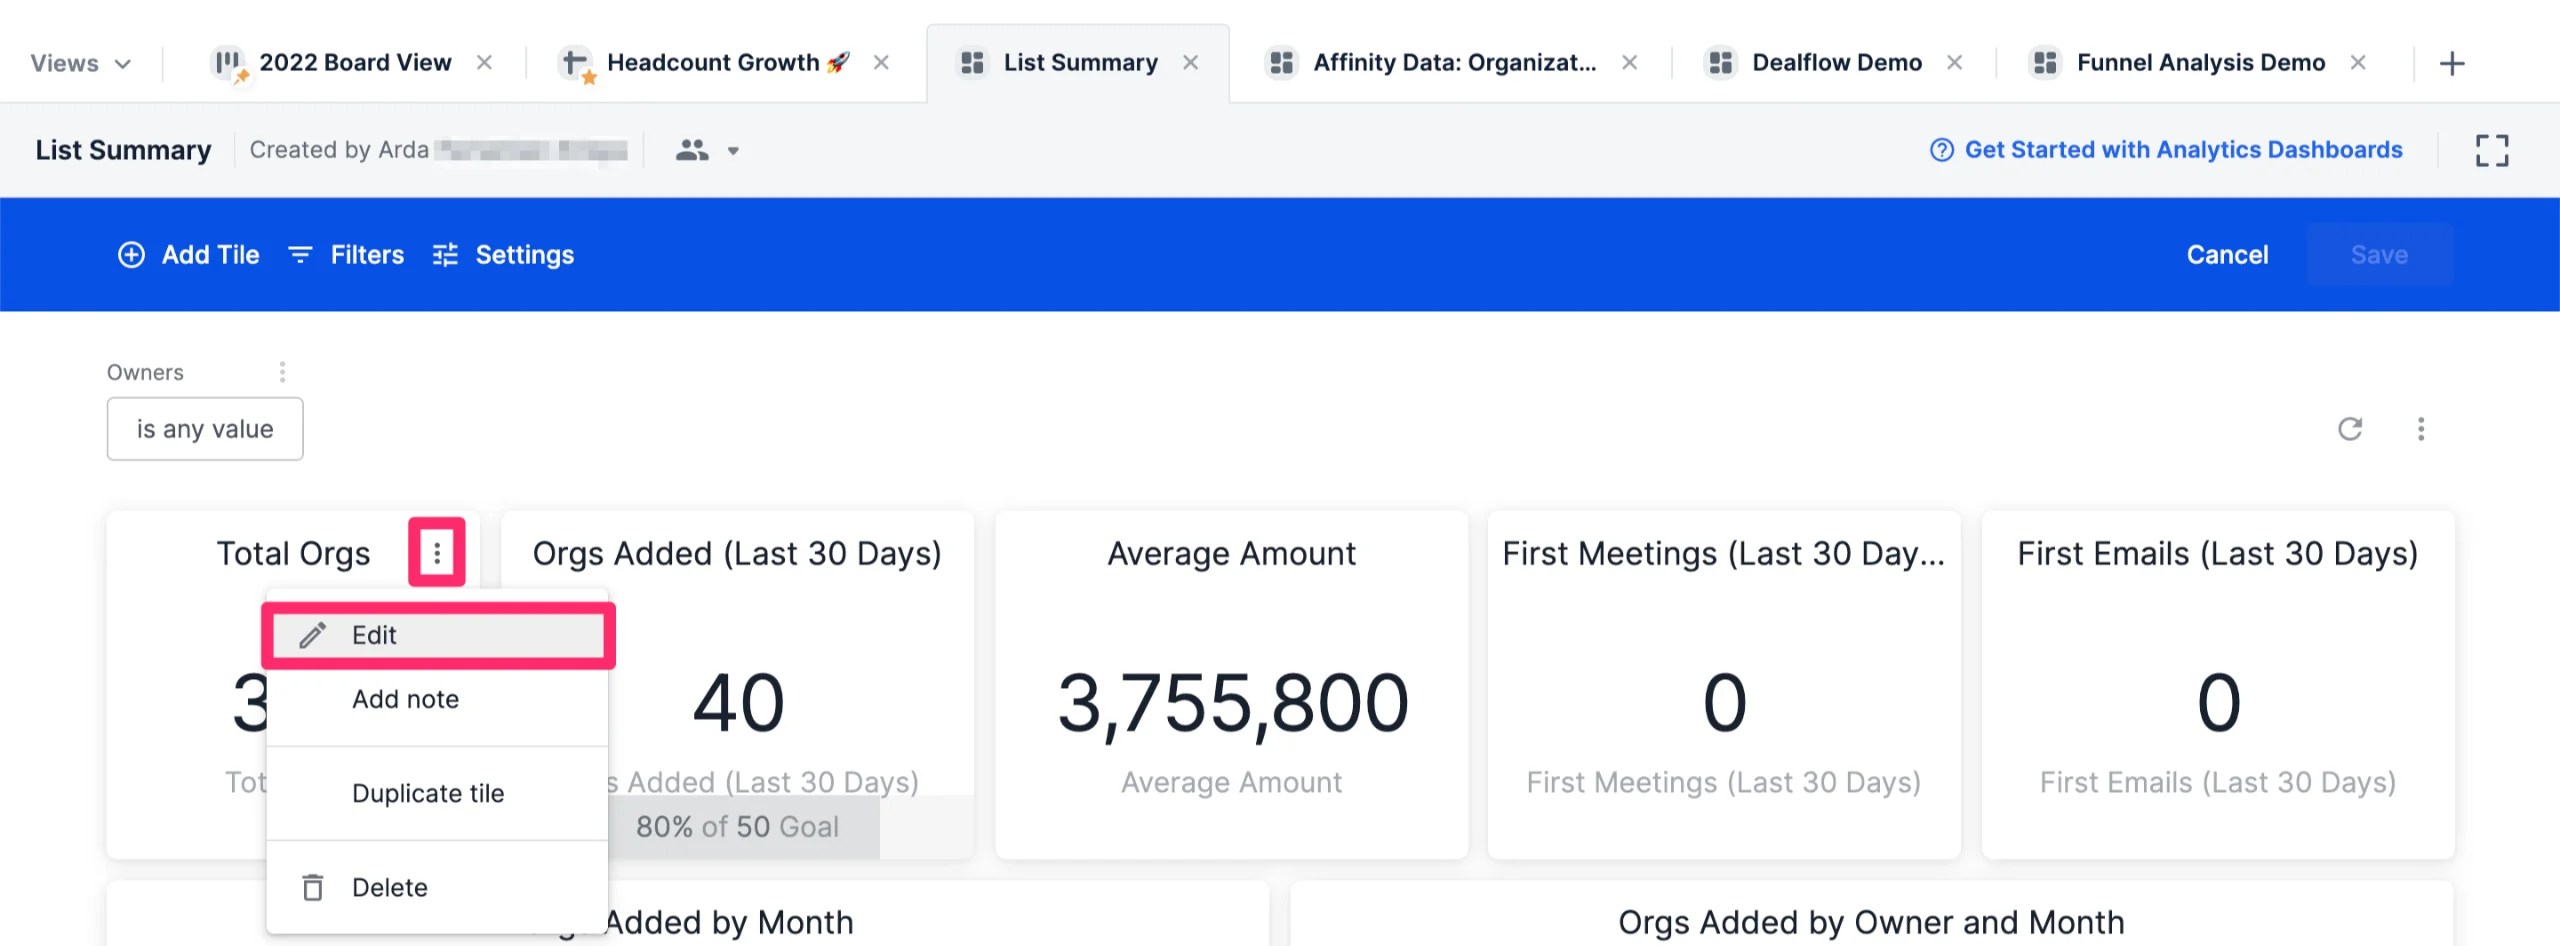
 4. If you'd like to change the data fields being used for certain visualization tiles, click the ellipsis (3-dotted icon) on the top-right corner, then click **Edit dashboard**.
 5. Then, click the ellipsis (3-dotted icon) on the top-right corner of the visualization tile you want to dig deeper into, then click **Edit**.
 ## How to use organization-based fields in your reports for opportunity lists
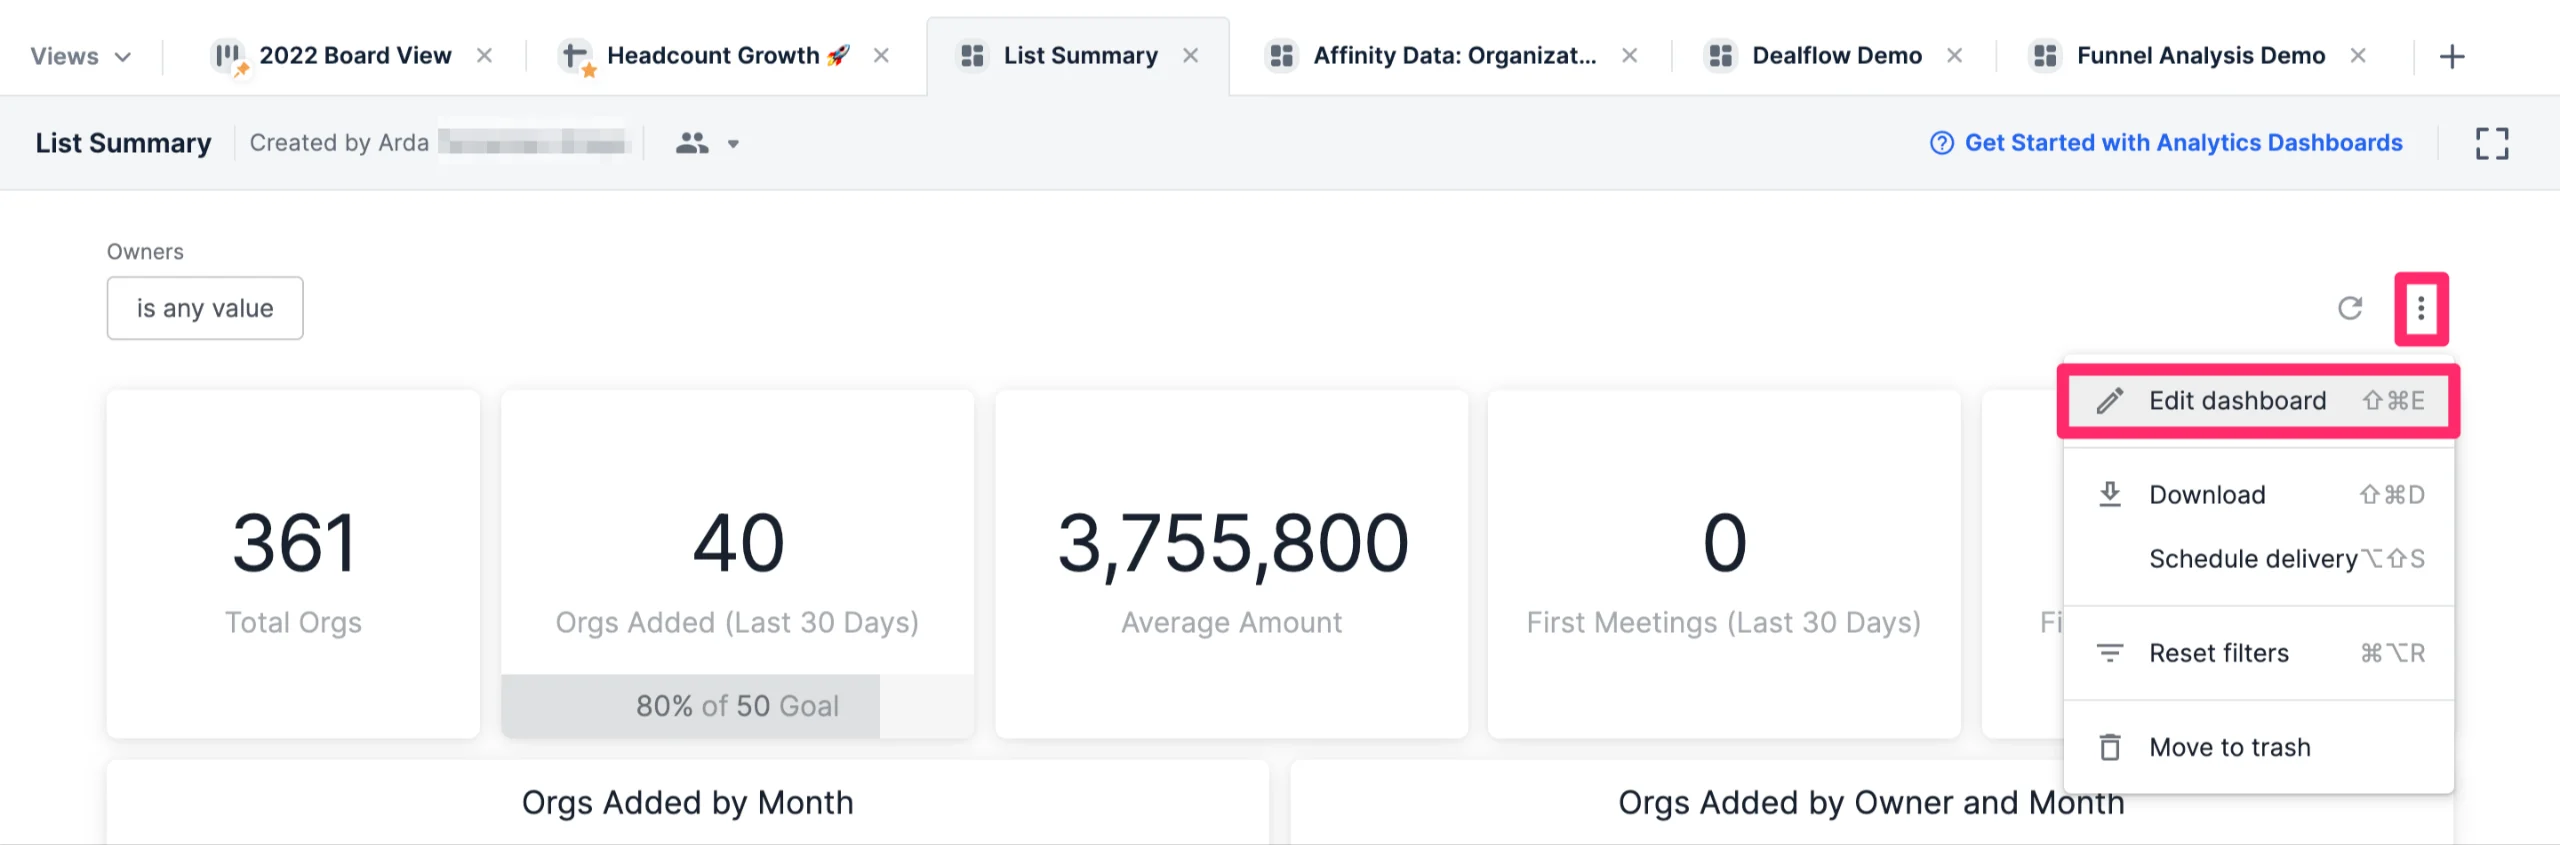
1. For those using opportunity lists and would like to use organization-based fields in their reports, click **Edit dashboard**.
## How to use organization-based fields in your reports for opportunity lists
1. For those using opportunity lists and would like to use organization-based fields in their reports, click **Edit dashboard**.
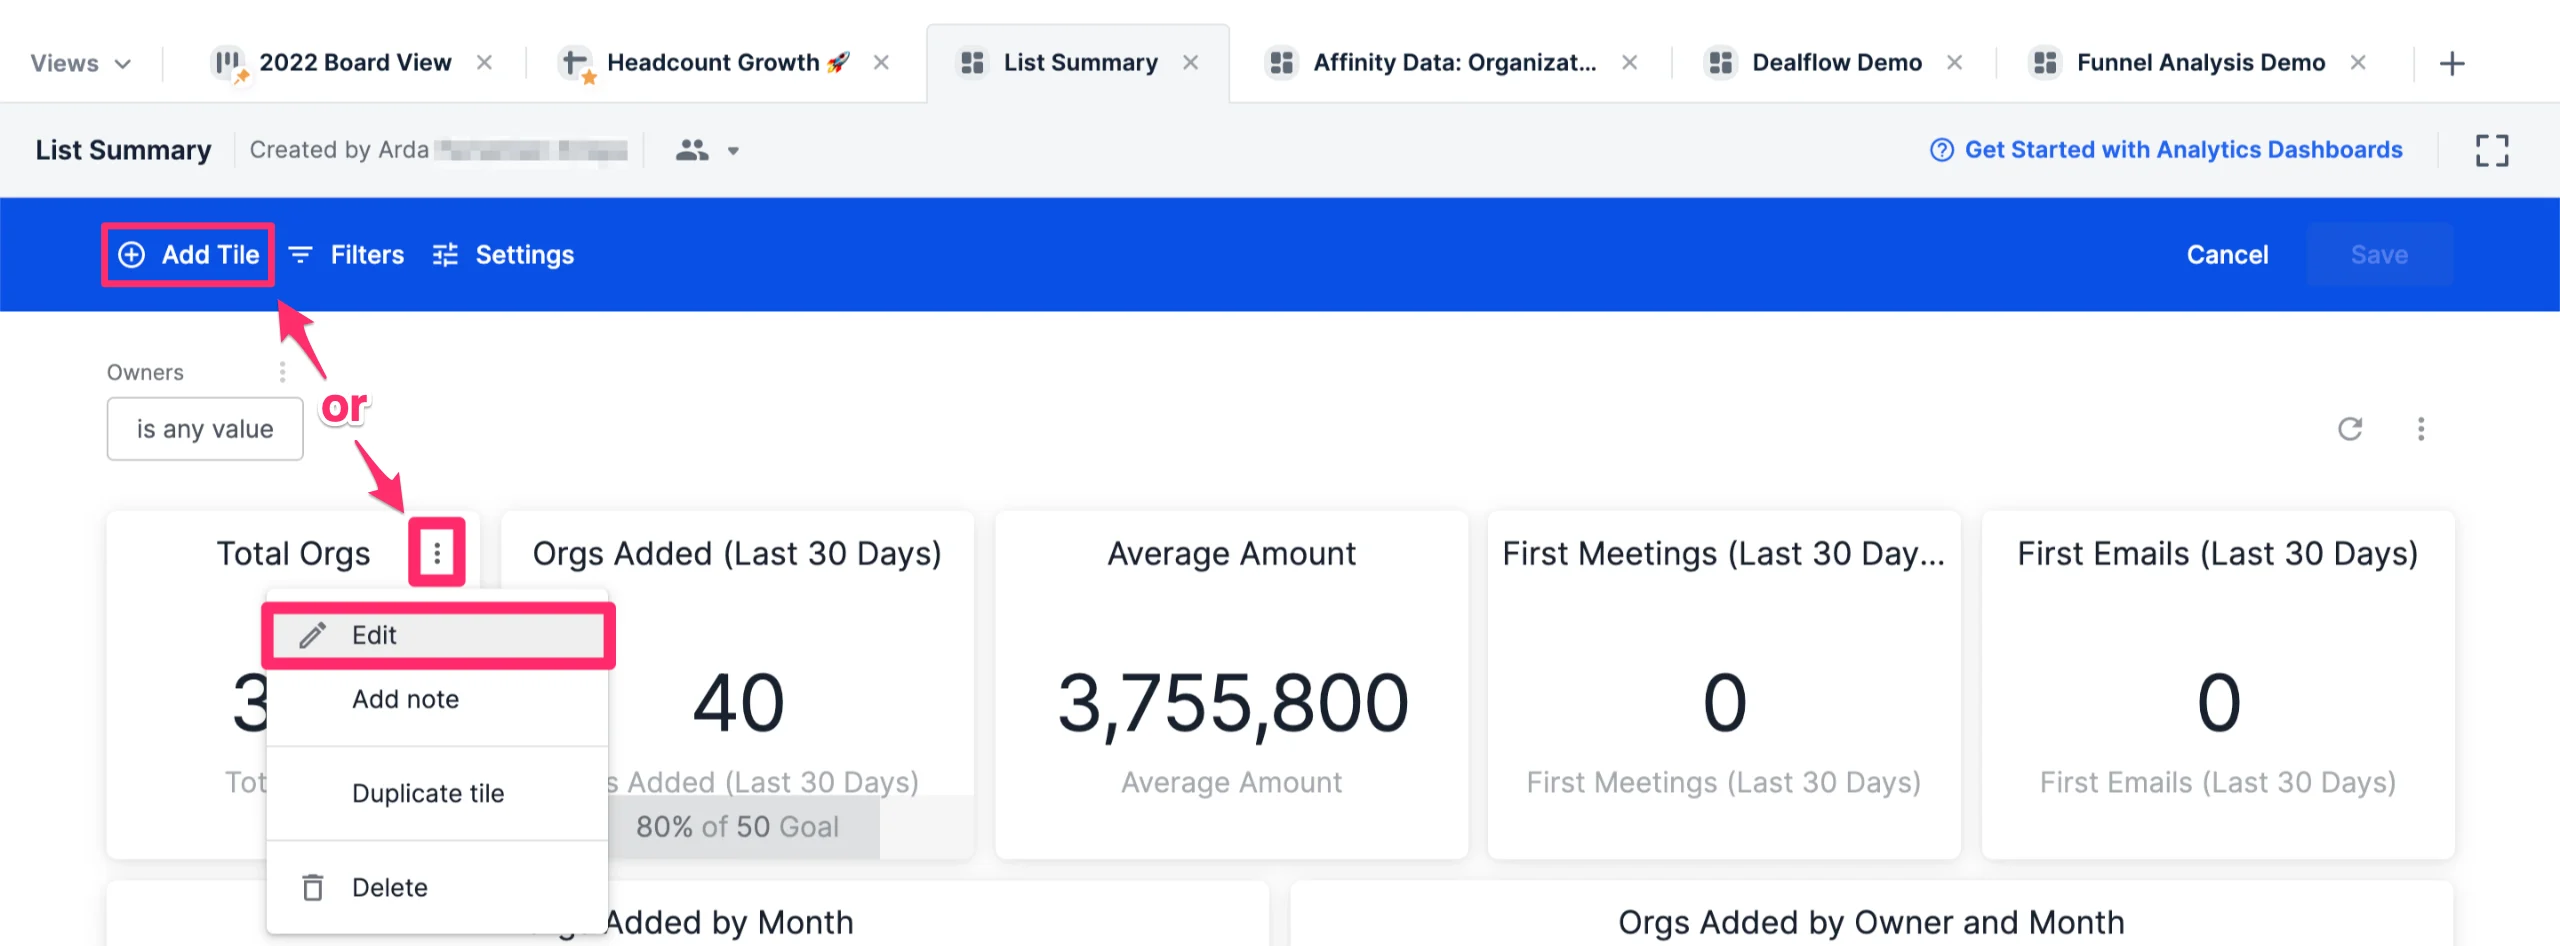
 2. Then, create a new visualization tile or click the ellipsis (3-dotted icon) within an existing visualization tile you'd like to change, then click **Edit**.
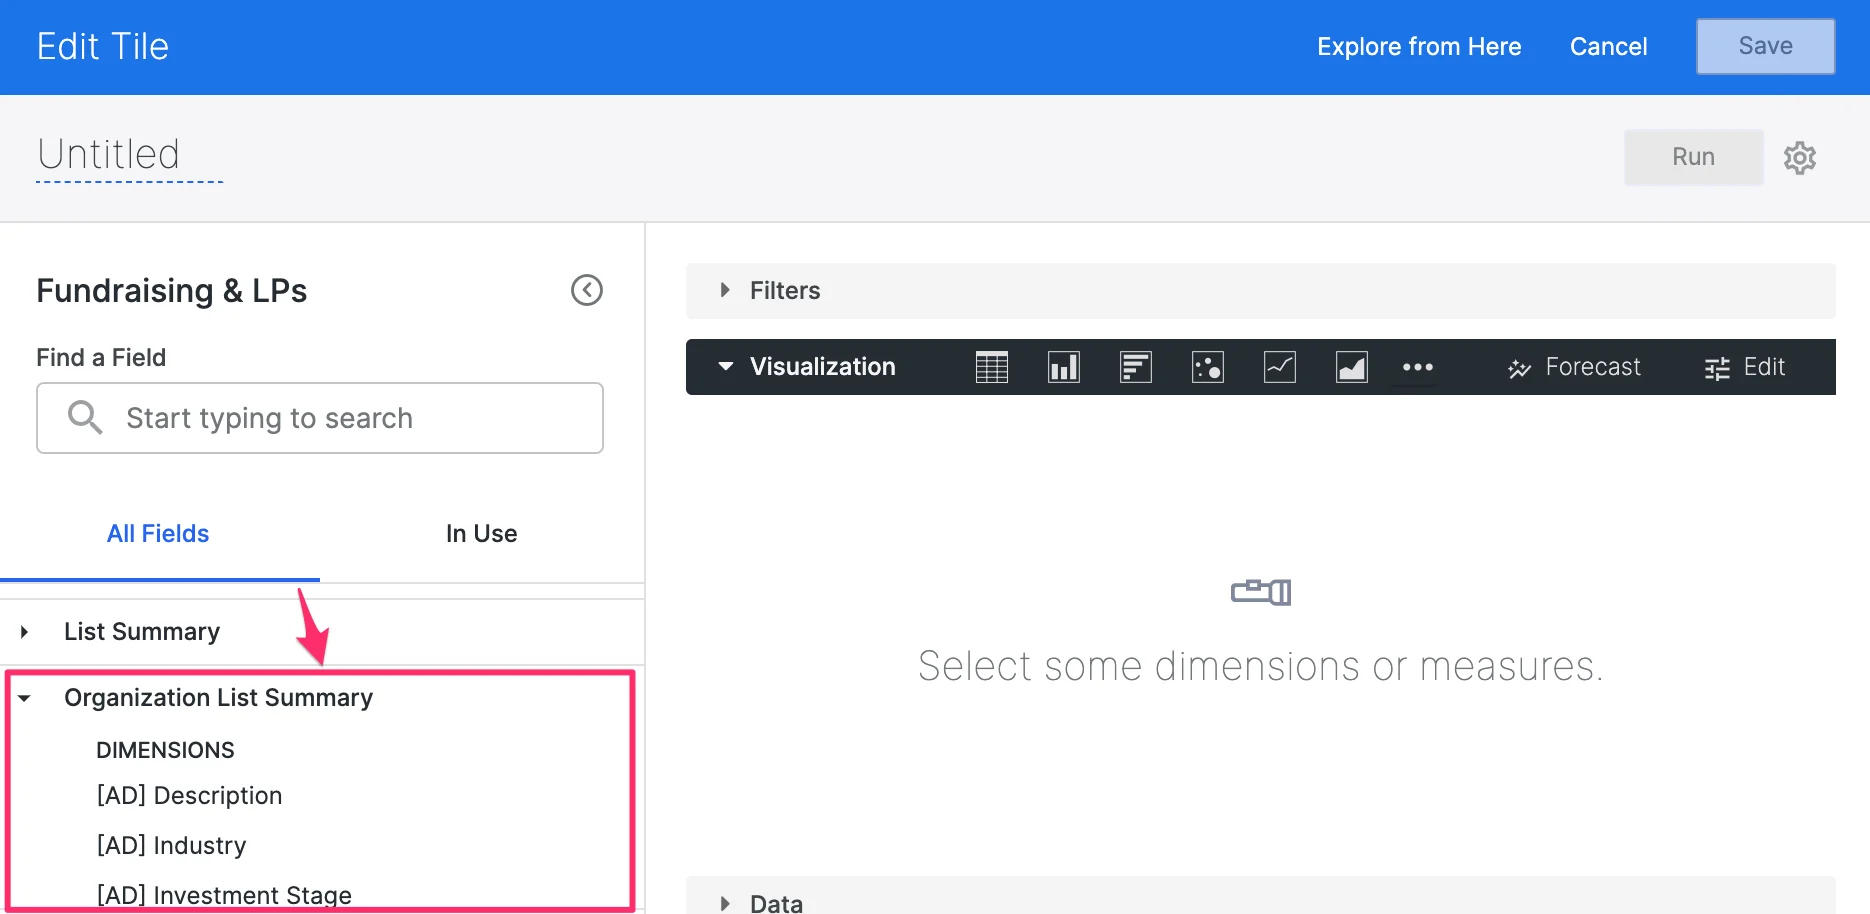
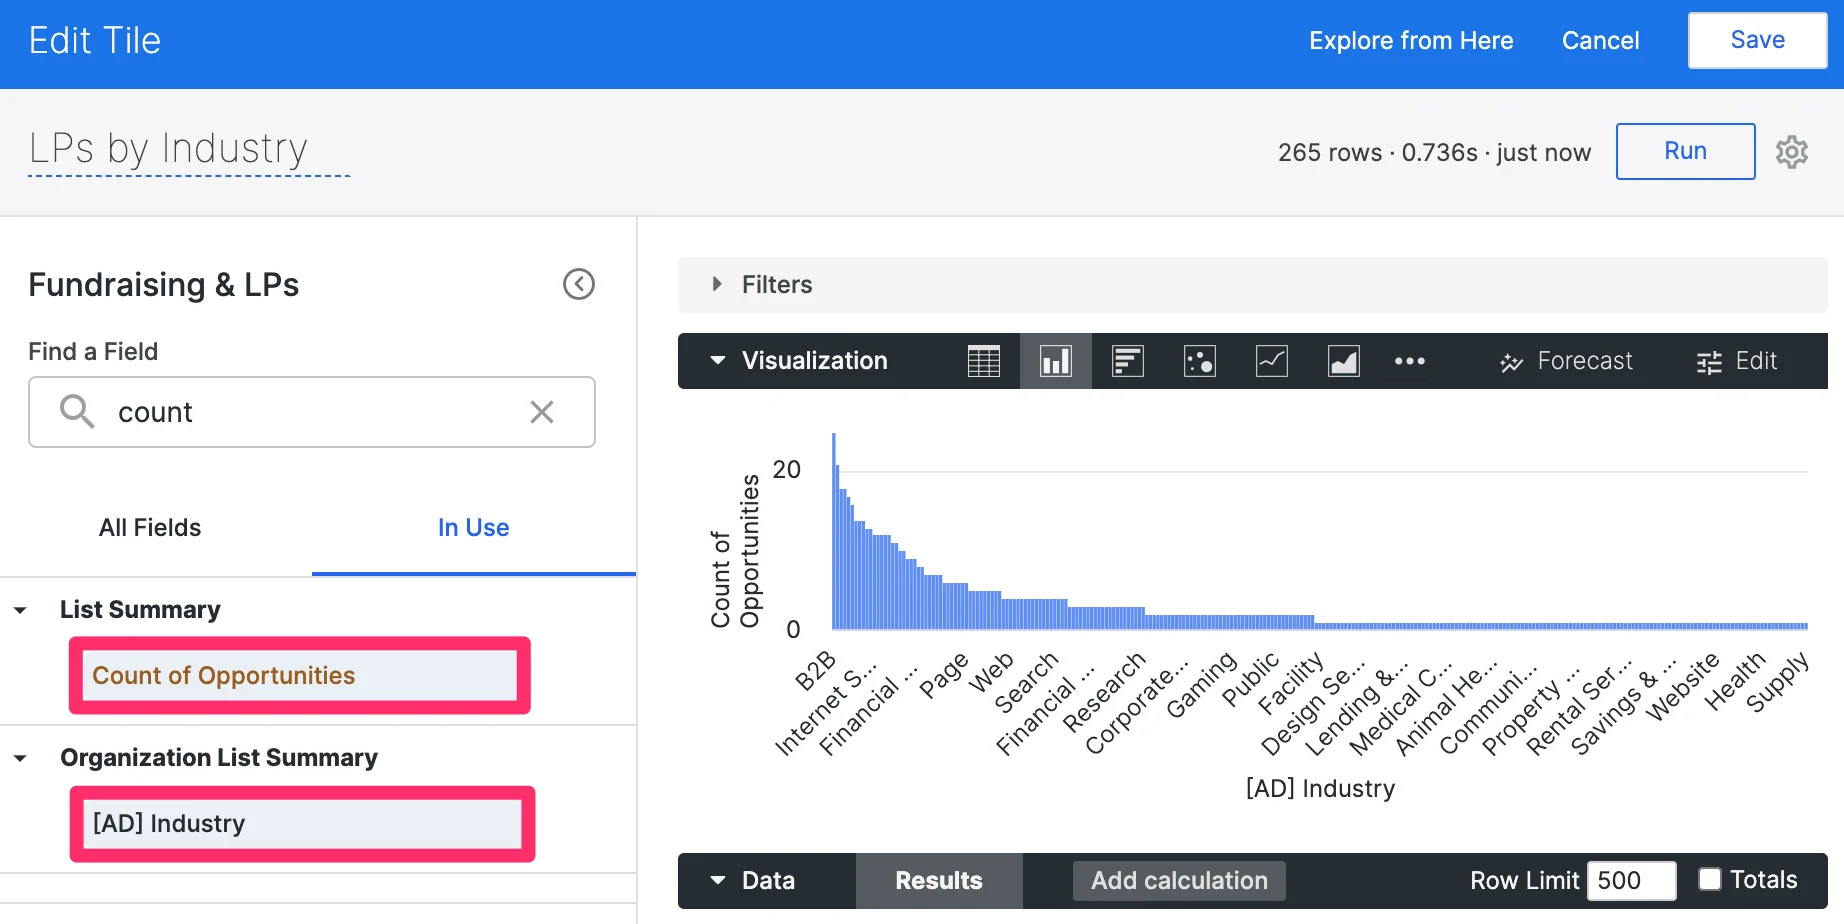
 3. On the left-side, click on the **All Fields** tab. You'll notice the organization-based fields under the section titled **Organization List Summary**.
 4. You can start using these fields to modify your visualization tiles and include organization-based data based on the organization that's associated with the opportunity. For example, you can now identify the **Count of Opportunities** based on Affinity Data's **Industry** field for organizations.
 To learn more about customizing, filtering, and pivoting data on your dashboard view, check out the following articles to take your skills to the next level:
* [How to create a dashboard view](/s/article/How-to-create-a-dashboard-view)
* [How to create custom groups in dashboard views](/s/article/How-to-create-custom-groups-in-dashboard-views)
* [How to apply filters in dashboard views](/s/article/How-to-apply-filters-in-dashboard-views)
* [How to pivot data on your dashboard views](/s/article/How-to-pivot-data-on-your-dashboard-views)
## Related topics
- [Affinity Analytics Introductions Summary Reports](/s/article/Affinity-Analytics-Introductions-Summary-Reports.md)
- [Basic Reporting List Summary Reports](/s/article/Basic-Reporting-List-Summary-Reports.md)
- [How To Track Introductions In Affinity](/s/article/How-to-track-introductions-in-Affinity.md)
- [Affinity Analytics Funnel Analysis Reports](/s/article/Affinity-Analytics-Funnel-Analysis-Reports.md)
- [Affinity Analytics Team Activity Reports](/s/article/Affinity-Analytics-Team-Activity-Reports.md)
To learn more about customizing, filtering, and pivoting data on your dashboard view, check out the following articles to take your skills to the next level:
* [How to create a dashboard view](/s/article/How-to-create-a-dashboard-view)
* [How to create custom groups in dashboard views](/s/article/How-to-create-custom-groups-in-dashboard-views)
* [How to apply filters in dashboard views](/s/article/How-to-apply-filters-in-dashboard-views)
* [How to pivot data on your dashboard views](/s/article/How-to-pivot-data-on-your-dashboard-views)
## Related topics
- [Affinity Analytics Introductions Summary Reports](/s/article/Affinity-Analytics-Introductions-Summary-Reports.md)
- [Basic Reporting List Summary Reports](/s/article/Basic-Reporting-List-Summary-Reports.md)
- [How To Track Introductions In Affinity](/s/article/How-to-track-introductions-in-Affinity.md)
- [Affinity Analytics Funnel Analysis Reports](/s/article/Affinity-Analytics-Funnel-Analysis-Reports.md)
- [Affinity Analytics Team Activity Reports](/s/article/Affinity-Analytics-Team-Activity-Reports.md)